
Which Graph Represents A Function
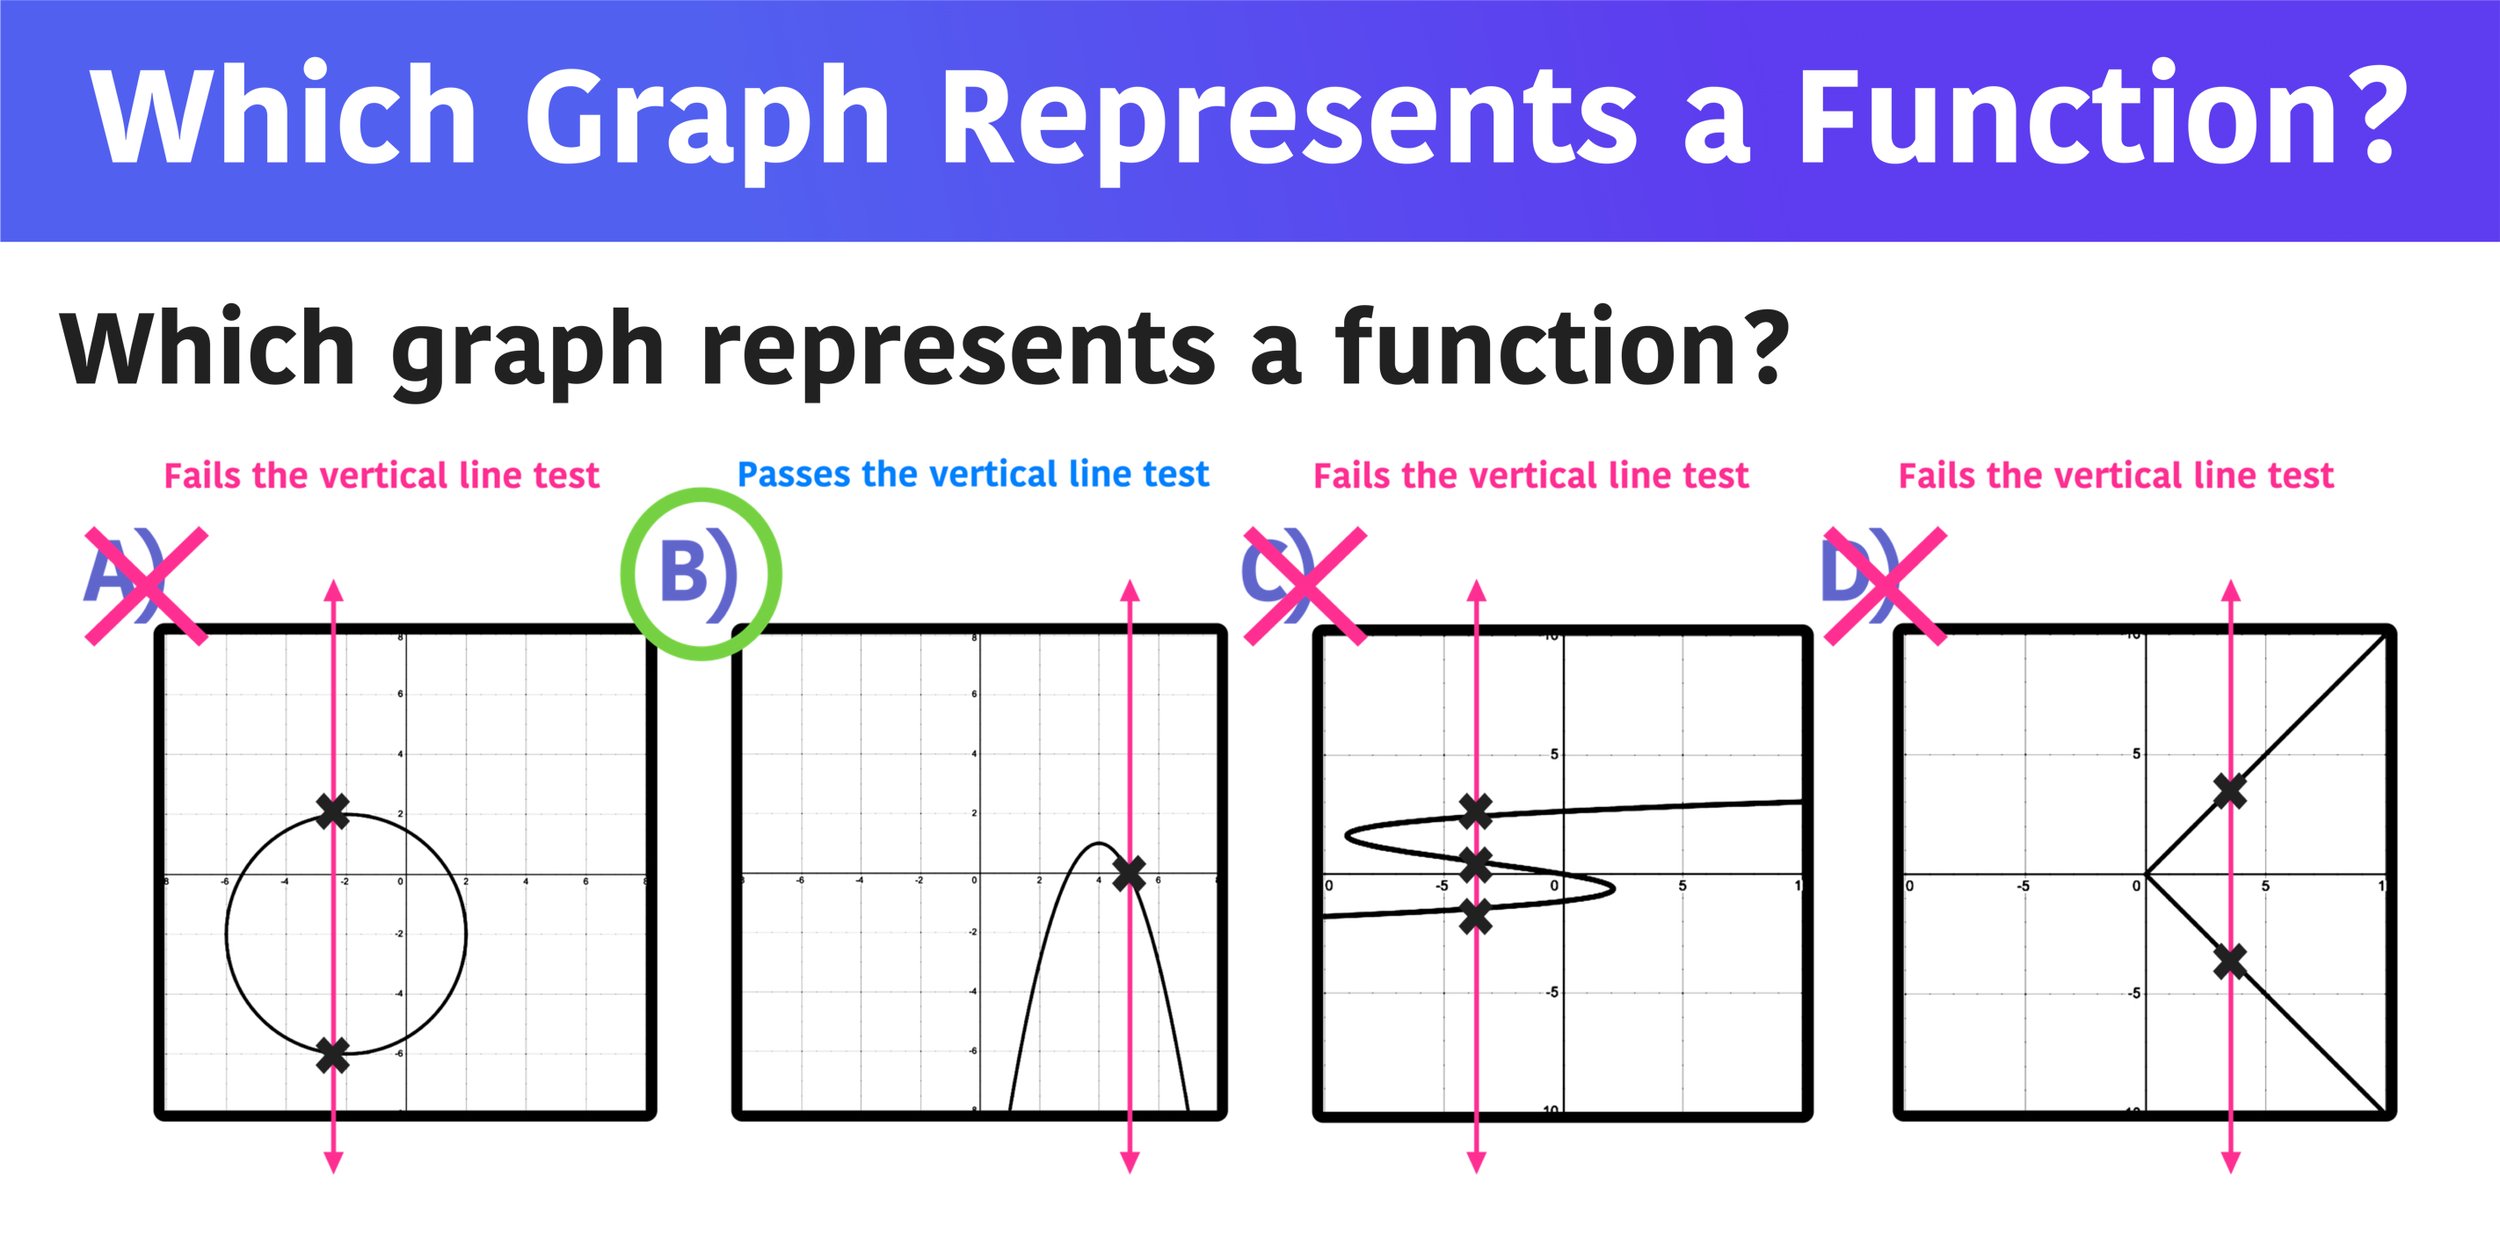
Let's talk about graphs. You know, those squiggly lines and curves that sometimes look like roller coasters and sometimes look like...well, squiggles. We see them everywhere, from stock market reports to weather forecasts. But some graphs are special. They're functions. And figuring out which ones are is surprisingly like playing a dating game.
The Vertical Line Test: Your Relationship Counselor
Imagine each graph is a potential romantic partner. You want someone reliable, predictable, someone who isn't going to flake on you. In the world of functions, that reliability is checked using something called the Vertical Line Test. Think of it as your slightly judgmental, but ultimately helpful, relationship counselor.
What does the Vertical Line Test do? Simple. You draw a vertical line anywhere on the graph. If that line hits the graph more than once, alarm bells should be ringing. This is the equivalent of your potential partner having multiple dates scheduled for the same time. Not a good sign, right?
Must Read
If the vertical line only ever touches the graph once, no matter where you draw it, congratulations! You've found yourself a function. This graph is reliable, predictable, and will give you only one output (y-value) for every input (x-value). It's the solid, dependable type you can bring home to your parents.
Why is the Vertical Line Test so Judgy?
Let's say you're plotting the price of a cup of coffee (y-axis) versus the number of hours since sunrise (x-axis). A function would mean that at any given hour after sunrise, there's only one price for a cup of coffee. Makes sense, right? But if you had a graph where, at 9 AM, the coffee was both $2 and $5...well, that's just chaos! That's a graph that fails the Vertical Line Test, and that's a graph that isn't a function. It's like the coffee shop is having an identity crisis.
Think of it this way: a function is like a vending machine. You put in your money (the x-value), and you get one specific snack (the y-value) every time. If you put in a dollar and sometimes you get a bag of chips, sometimes you get a candy bar, and sometimes you get nothing at all...that's a broken vending machine, and it's definitely not a function!
Examples of Functional (and Not-So-Functional) Relationships
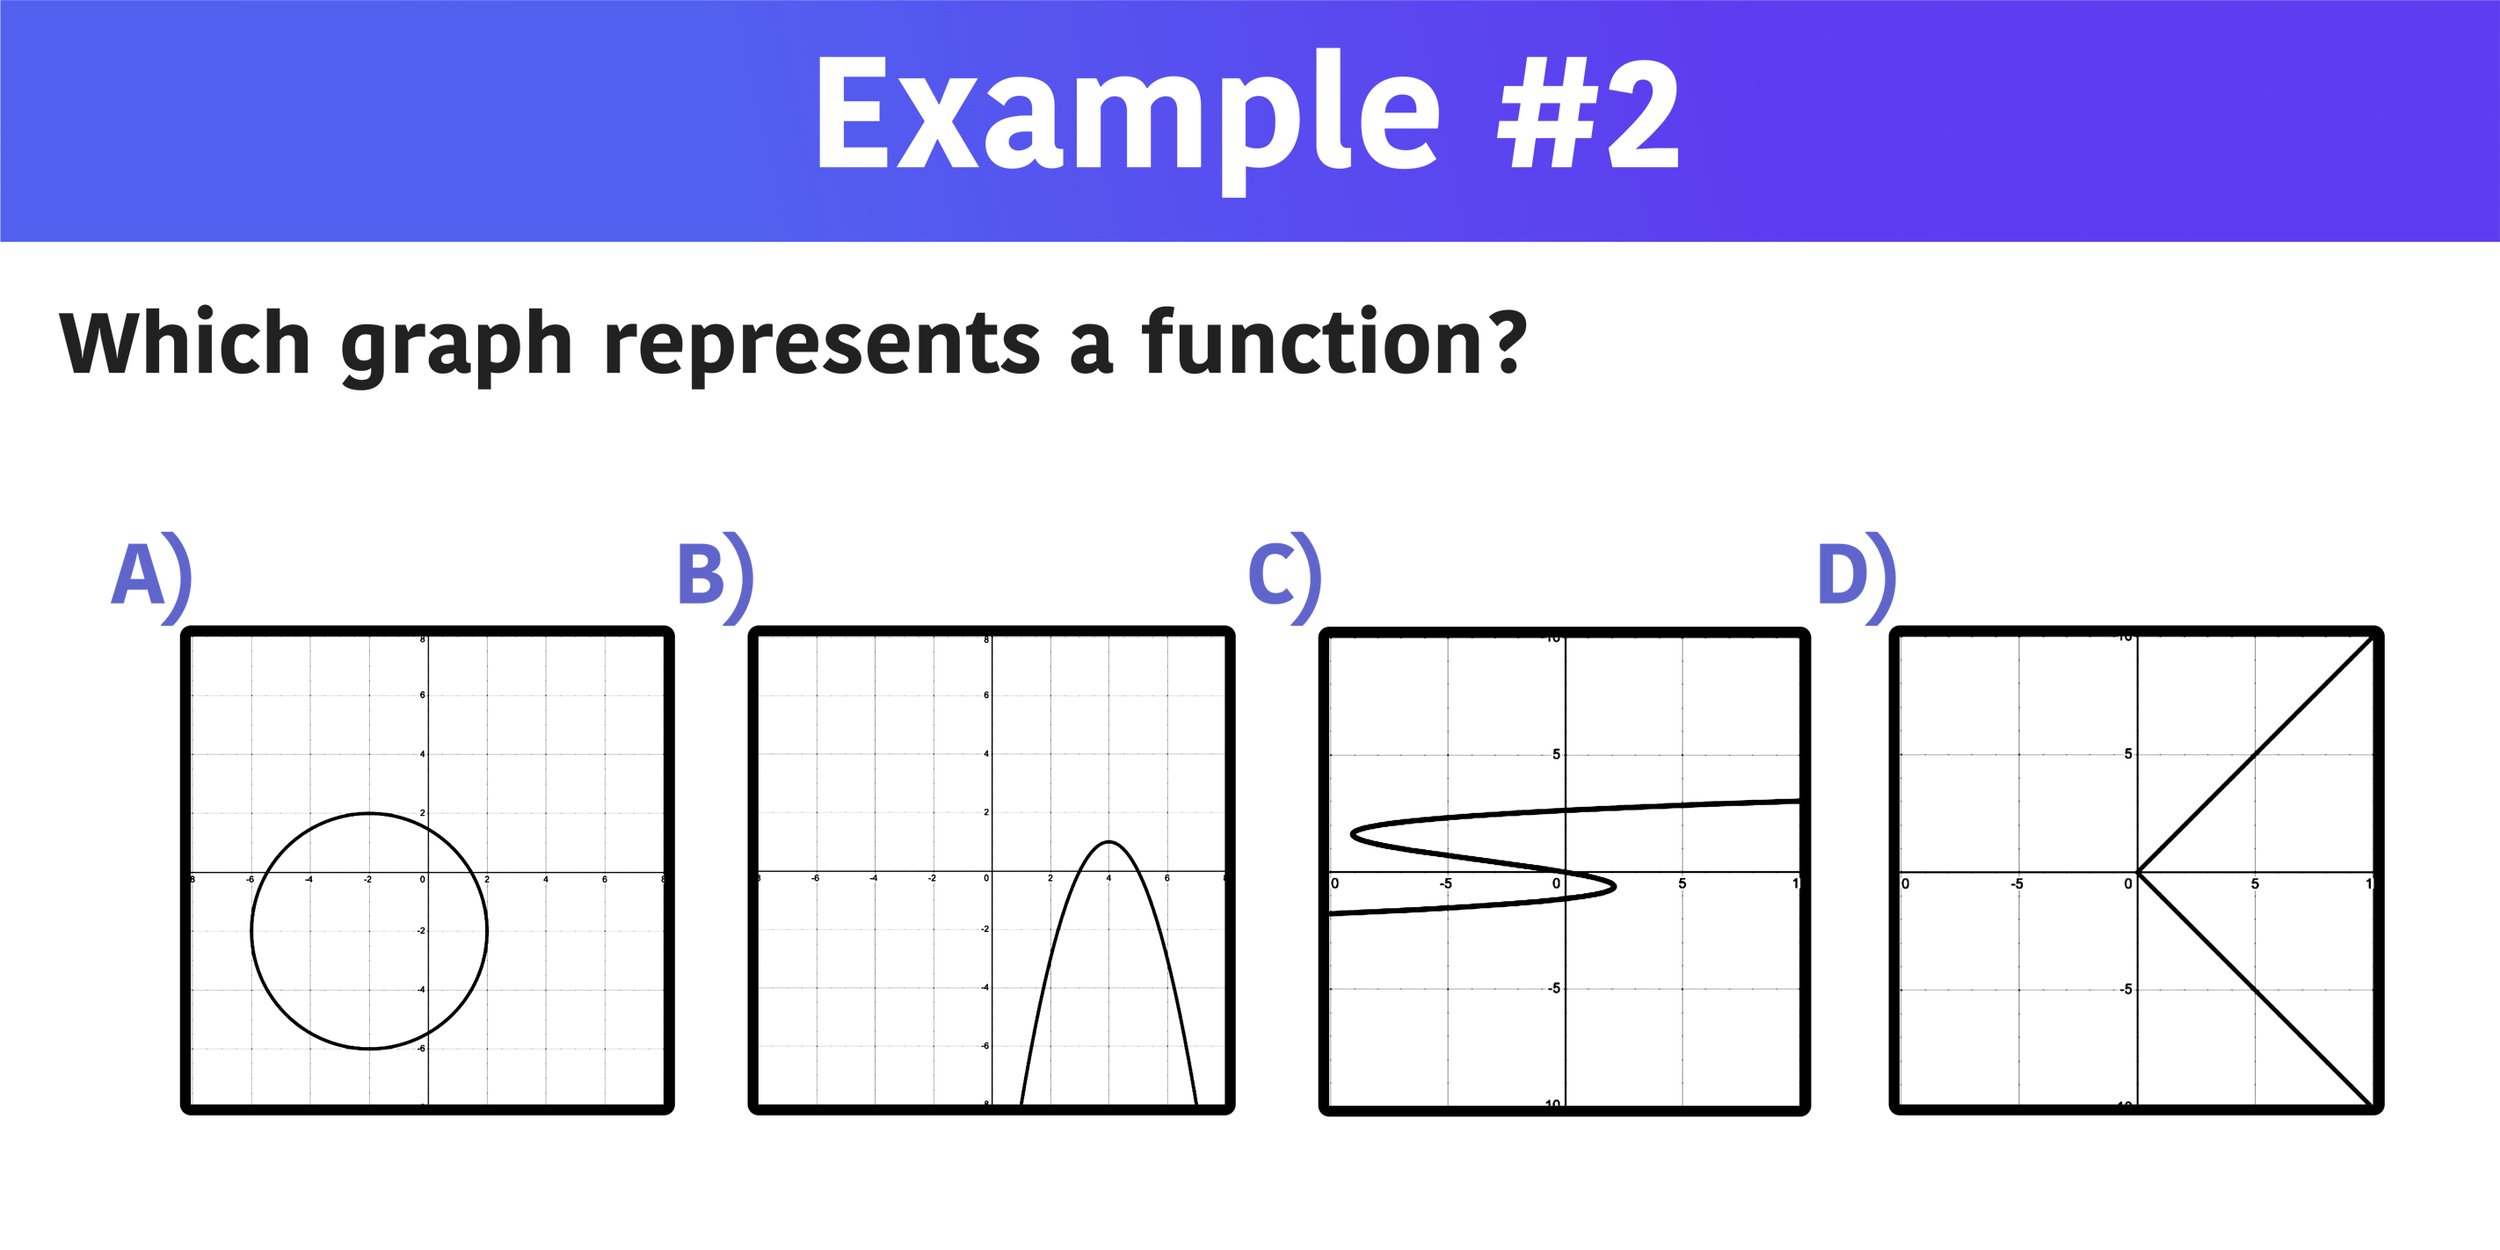
A straight line is often a function. It's straightforward, honest, and easy to understand. A parabola (that U-shaped curve) is also usually a function. It's got a little drama, but it's still predictable. Now, a circle? A circle is a heartbreaker. Draw a vertical line through the middle, and BAM! Two intersections. The circle fails the Vertical Line Test and is declared not a function. It's too wishy-washy, giving you two possible y-values for the same x-value.

Graphs that wiggle and wave wildly can be functions, as long as they don't double back on themselves in a way that allows a vertical line to hit them more than once. It's like that friend who's a bit of a whirlwind, but you always know (within reason!) what to expect.
The Takeaway: Look for Reliability
So, next time you see a graph, remember the Vertical Line Test. Is it reliable? Does it offer only one outcome for each input? If so, you've got a function! If not, it's just a graph with commitment issues. Don't get too attached. The Vertical Line Test is your shield against heartbreak in the world of graphs.
Don't worry too much about the fancy math terms like domain and range just yet. The core idea is simple: one input, one output. Think of it as the golden rule of graph relationships. If a graph can't adhere to it, move on! There are plenty of other perfectly functional graphs out there.
And remember, even though circles might not be functions, they're still pretty to look at. Just like some people, some graphs are better suited for admiration from afar.
Now go forth and confidently judge graphs! You are armed with the power of the Vertical Line Test and a healthy dose of relationship skepticism.
