Find The Slope Of A Line Passing Through Points
Alright, settle in folks! Let's chat about something that might sound intimidating, but is actually super cool: finding the slope of a line. I know, I know, "slope" might bring back memories of math class induced anxiety. But trust me, we're going to break it down in a way that's, dare I say, fun.
Think of slope like this: it's the steepness of a hill. If you're biking uphill, a steep hill is, well, hard work! A gentle slope? Easy peasy. That's essentially what we're measuring with a line’s slope.
So, What IS Slope, Really?
Okay, so what exactly is the slope? In mathematical terms, it’s the ratio of the vertical change (rise) to the horizontal change (run) between any two points on a line. Did that sound too technical? Let’s put it this way: Imagine you're building a ramp. The slope tells you how much the ramp goes up (the "rise") for every step forward (the "run").
Must Read
We often write slope as "m," which is kind of random, right? Why "m"? There are a few theories, but the most common one is that it comes from the French word "monter," which means "to climb" or "to ascend." Makes sense, doesn't it?
Now, how do we actually calculate this magical "m"?
The Formula: Don't Panic!
Here comes the formula! Ready? It's actually pretty simple:
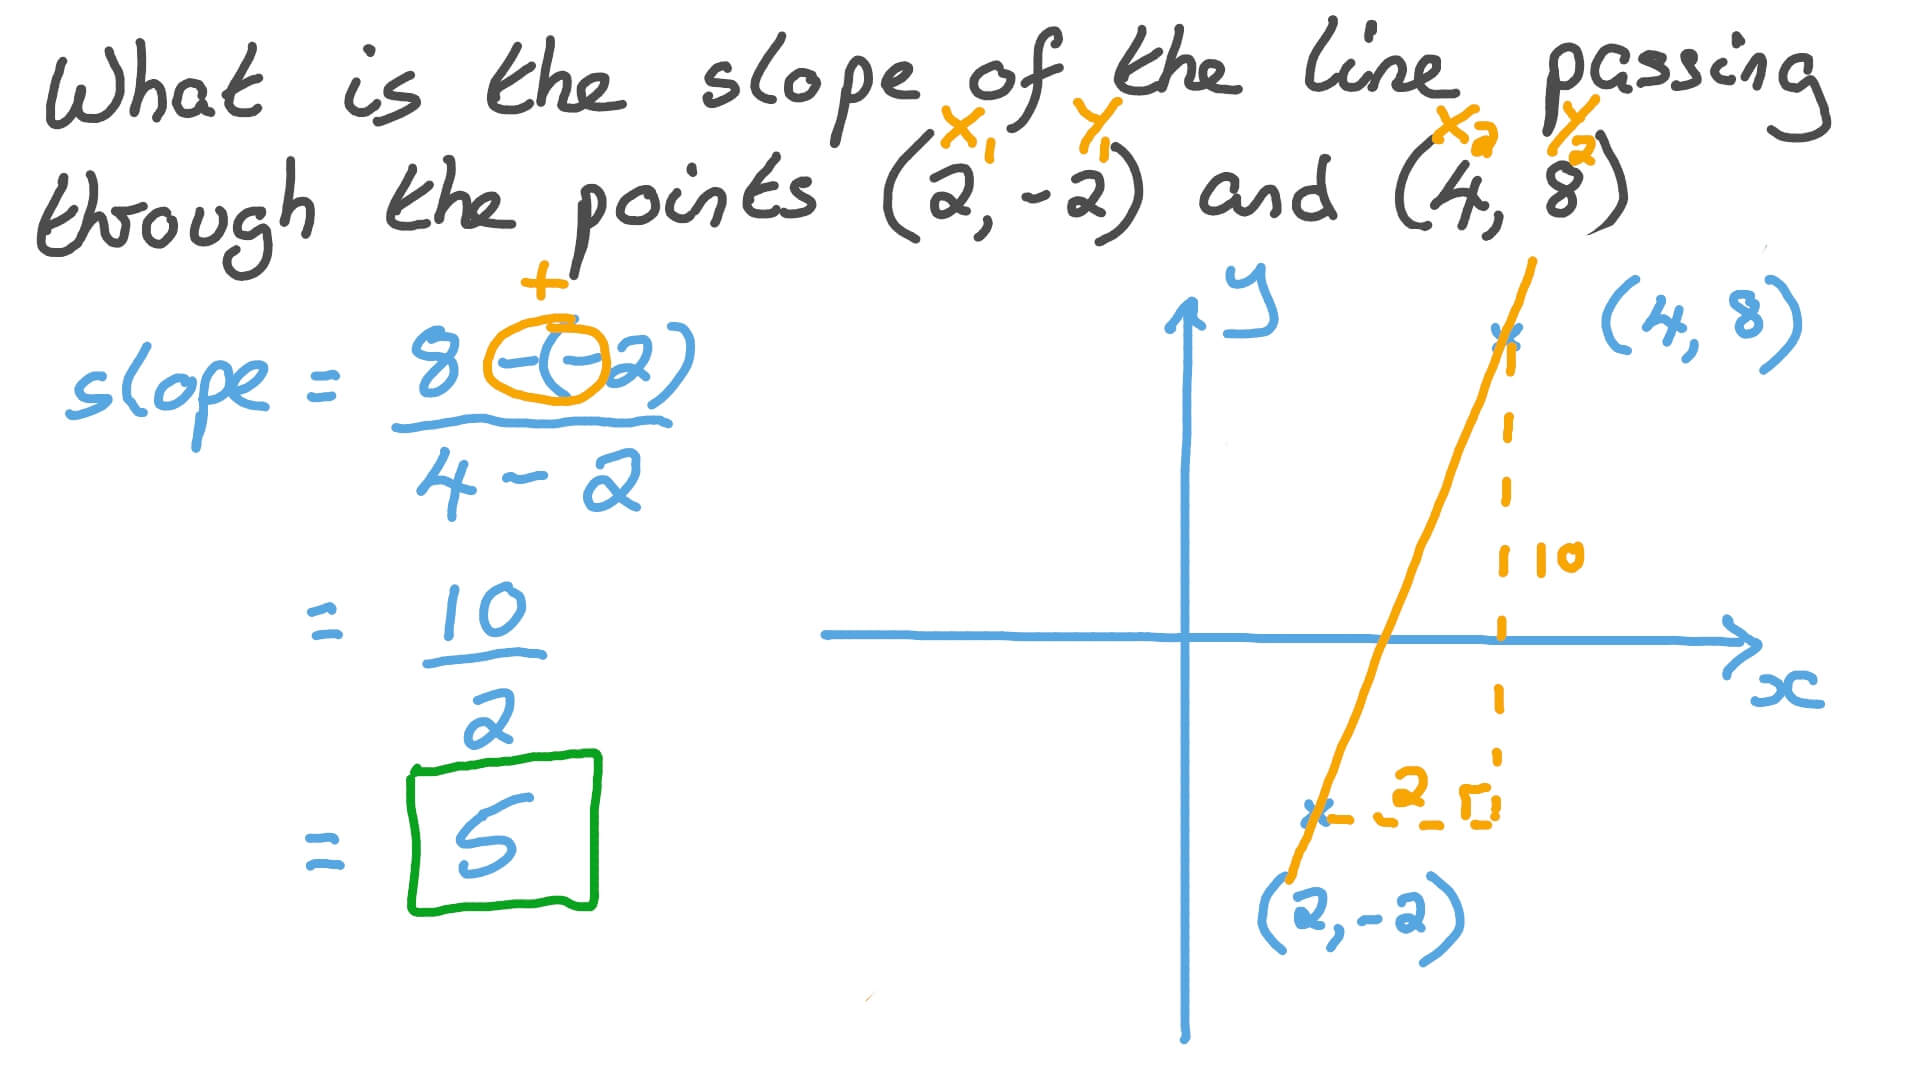
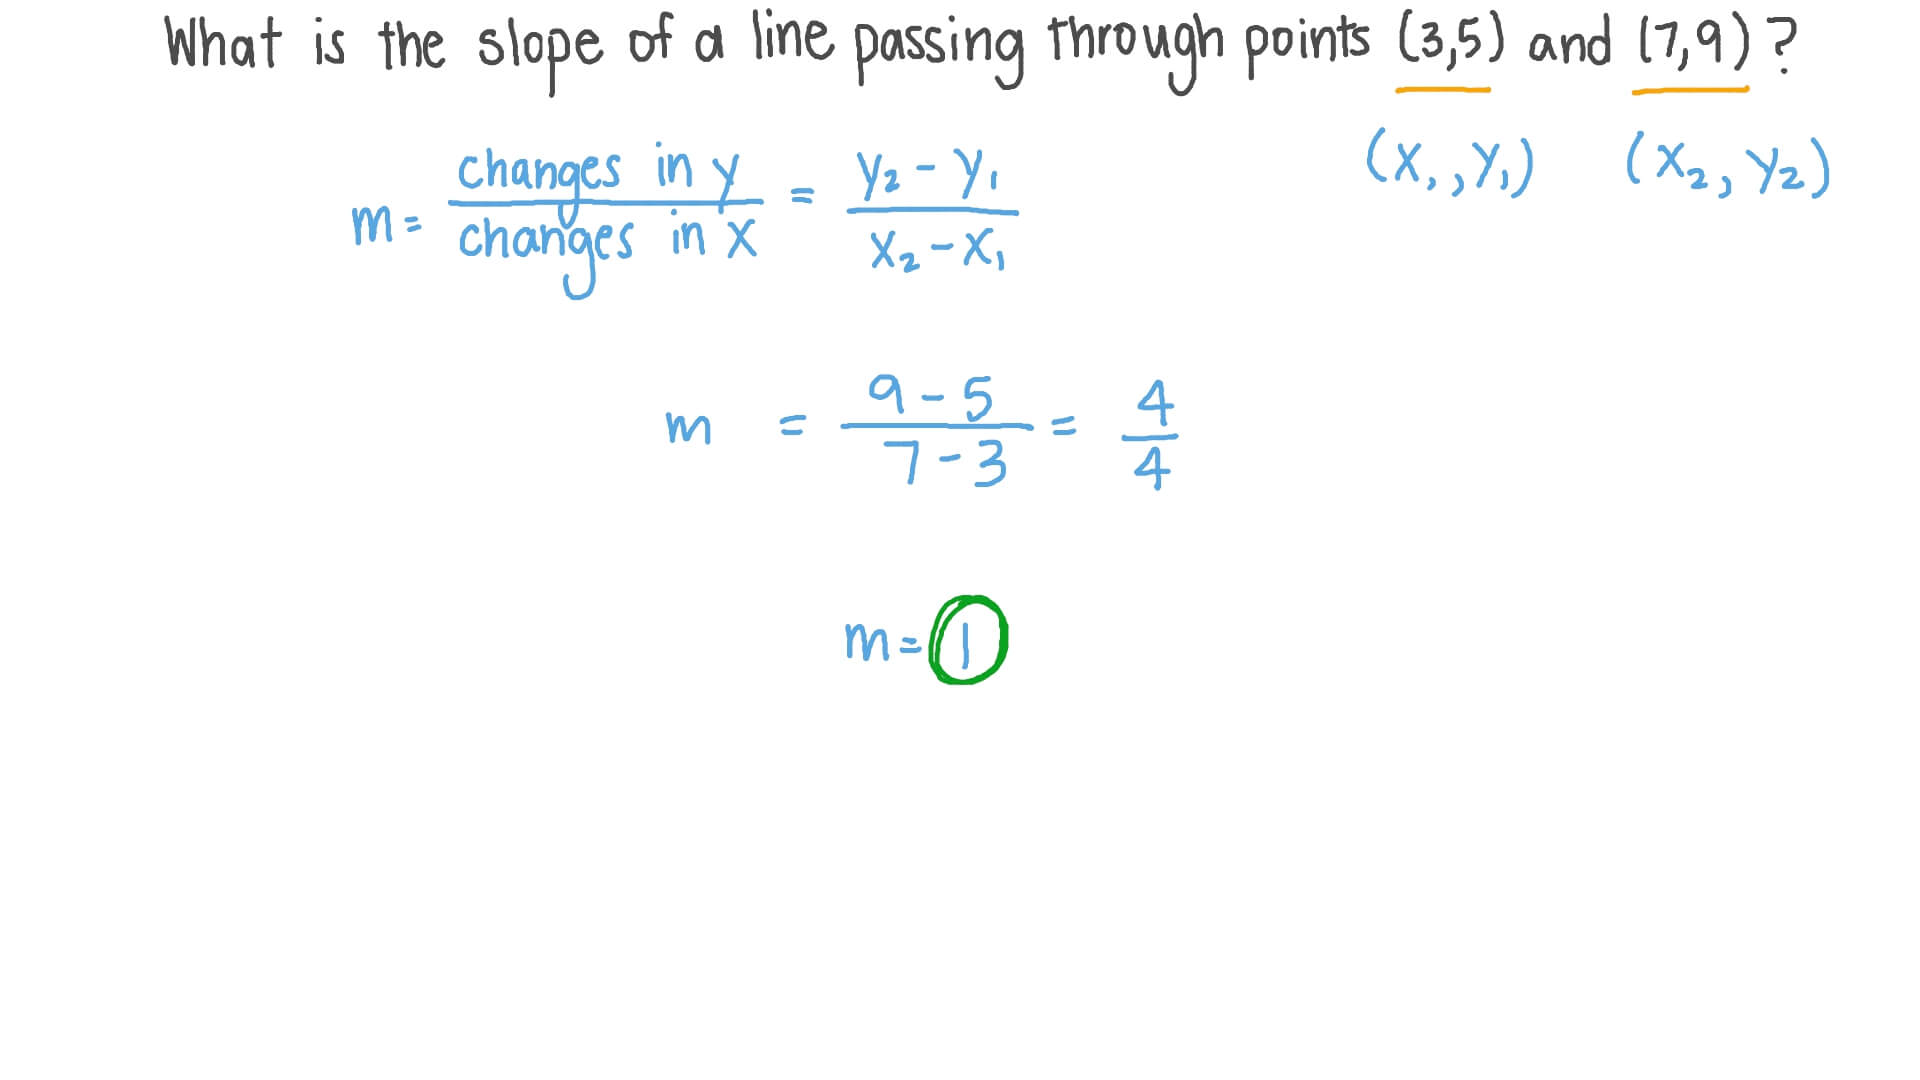
m = (y2 - y1) / (x2 - x1)
Whoa! Okay, let’s unpack that. Essentially, we need two points on our line. Let's call them Point 1 and Point 2. Each point has an x-coordinate and a y-coordinate, just like on a graph. So, Point 1 is (x1, y1) and Point 2 is (x2, y2).
See what we're doing? We're finding the difference in the y-coordinates (that's the "rise") and dividing it by the difference in the x-coordinates (that's the "run").

Let's try an example! Suppose we have two points: (1, 2) and (4, 8).
- x1 = 1
- y1 = 2
- x2 = 4
- y2 = 8
Plugging those numbers into our formula, we get:
m = (8 - 2) / (4 - 1) = 6 / 3 = 2
So, the slope of the line passing through the points (1, 2) and (4, 8) is 2. What does that mean? It means that for every 1 unit we move to the right (the "run"), we move up 2 units (the "rise"). Think of climbing stairs! If each step you take forward makes you go up two steps. That is our slope!
Why is This Even Useful?
Great question! You might be thinking, "Okay, I can calculate a slope... so what? Why should I care?"
Well, slope is everywhere! It's in:
- Architecture: Designing ramps for accessibility, calculating roof pitches for proper drainage, and understanding structural integrity.
- Engineering: Designing roads and bridges, understanding the flow of water through pipes, and analyzing the motion of objects.
- Navigation: Figuring out the grade of a hill while hiking, or even understanding how altitude changes on a map.
- Even Finance! The slope of a line on a graph can represent the rate of growth of an investment over time.
See? It's not just some abstract math concept. It's a tool for understanding the world around us!

Different Types of Slopes
Not all slopes are created equal. Here's a quick rundown:
- Positive Slope: The line goes up from left to right. Like climbing a hill!
- Negative Slope: The line goes down from left to right. Like skiing downhill!
- Zero Slope: The line is perfectly horizontal. Flat as a pancake! (Think of a y = something equation)
- Undefined Slope: The line is perfectly vertical. Imagine trying to walk straight up a wall! (Think of a x = something equation)
Practice Makes Perfect
The best way to get comfortable with finding the slope of a line is to practice. Try a few examples on your own. Use graph paper to plot the points and visualize the line. You can even use online slope calculators to check your work. Don't be afraid to experiment and have fun with it! And remember, even if you stumble at first, you'll get there.
So, next time you see a hill or a ramp, think about the slope! You might be surprised at how much you already know.