Checking Crime Rates In A Neighborhood
Alright, gather ‘round, folks, and pull up a virtual armchair. We're about to delve into a topic that might seem a bit… well, less exciting than binge-watching a true-crime documentary, but trust me, it’s far more practical: how to check crime rates in a neighborhood. You know, before you sign that lease, or heaven forbid, commit to buying a house only to discover your new local hangout is a police lineup.
I’m not saying we all need to become super-sleuths, but a little pre-move research can save you a whole lot of headache. Think of it as forensic analysis for your future latte spot. And don't worry, we're going to keep this light, because nobody wants to feel like they're preparing for a spy mission just to pick out curtains.
The Official Scoop: Where the Numbers Live
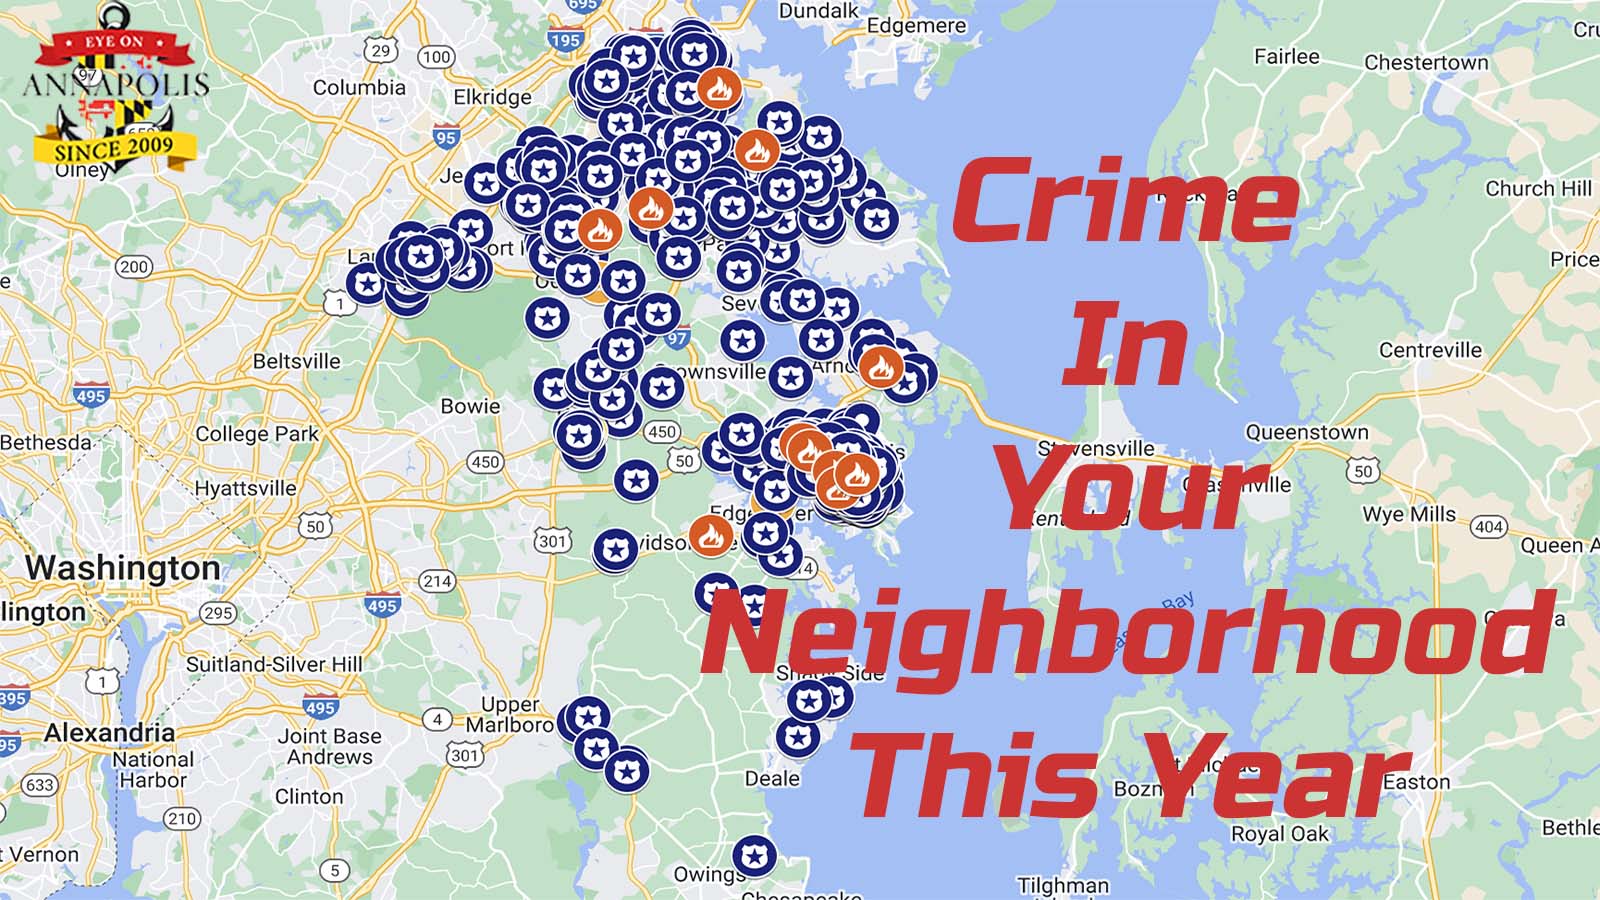
First up, let’s talk about the official sources. These are your bread and butter, your trusty sidekicks in the quest for knowledge. Your first port of call should always be the local police department's website. Most modern police forces have a section dedicated to crime statistics, and often, crime maps. Yes, actual maps where you can zoom in and see little icons representing various incidents. It's like Google Maps, but with less traffic and more... well, crime data.
Must Read
Now, sometimes these maps can be a bit clunky, designed by someone who clearly prioritizes data integrity over user experience. Don't be surprised if it looks like it was made in 2003. But stick with it! You're looking for information on things like burglaries, theft, assaults, and vandalism. Pay attention to the dates, too; you want recent data, not just a historical recap of the Great Pothole Heist of '98.
Another fantastic resource comes in the form of third-party crime mapping websites. Think SpotCrime, CrimeMapping.com, or even NeighborhoodScout. These sites often pull data from various police departments and present it in a much more digestible, aesthetically pleasing way. It’s like they took the official, slightly crusty data and gave it a sparkly new outfit. Some might ask you for a small fee for deeper dives, but the basic overview is usually free.

A fun fact to keep in mind: Did you know that property crimes (like theft and burglary) are far, far more common than violent crimes in most areas? So while it's important to look at both, don't let a spike in package thefts send you spiraling into a panic about becoming a modern-day Sherlock Holmes trying to protect your teacups. Context is key!
Beyond the Data: The "Vibe Check"
Numbers are great, but they don't tell the whole story. This is where your inner detective, or at least your inner highly observant person who notices things, comes in. I call this the "Vibe Check."
Take a walk or a drive around the neighborhood, preferably at different times of day and night. Seriously, go during the day to see kids playing and people walking dogs. Then, go back after dark. Do the streets feel well-lit? Are there people out and about, or does it feel deserted? Is the local park teeming with life, or suspiciously empty?

Another brilliant move? Talk to the locals! This is where you get the unvarnished, often hilarious, truth. Pop into a local coffee shop, a small independent grocery store, or even strike up a conversation with someone walking their dog. Ask them what they like about the neighborhood, what are the common issues, or if there's anything they wish they knew before moving in. You'd be amazed what a friendly face and a genuine question can uncover.
Be warned, though: you might get an earful about the noisy neighbor's chihuahua or the eternal saga of overflowing recycling bins. But amidst the local gossip, you'll often find nuggets of genuinely useful information about community safety, recent incidents, or specific areas to be more aware of.

What to Look For (and Not Panic About)
When you're sifting through all this data and anecdotal evidence, here's what to keep your eye on:
- Trends, Not Just Incidents: Is crime consistently rising, or was there just a single, isolated incident that skewed the stats? A one-off major event can happen anywhere. A steady upward trend is more concerning.
- Type of Crime: Are we talking about car break-ins, or something more serious? Every crime is unfortunate, but there's a difference between opportunistic theft and organized crime.
- Proximity: Is the crime clustered right on your potential doorstep, or is it a few blocks away in a different commercial zone? Location, location, location, even for crime.
- Context is King: A vibrant downtown area with lots of nightlife will naturally have more reported incidents (like public intoxication or minor assaults) than a quiet suburban cul-de-sac. That doesn’t necessarily make it "more dangerous," just different.
Ultimately, checking crime rates isn't about finding a magically crime-free utopia (spoiler alert: it doesn't exist outside of perhaps a very well-guarded vault). It's about being informed, understanding the real risks, and making a decision you feel comfortable with. It's about ensuring your biggest concern in your new neighborhood is whether to get a second scoop of ice cream, not whether your bike will still be there in the morning.
So go forth, prospective residents! Be curious, be observant, and apply a healthy dose of common sense. And maybe, just maybe, you'll uncover some surprising facts – like how that sleepy little town you discounted actually has a much lower crime rate than the trendy, bustling spot everyone’s raving about. Happy sleuthing!
