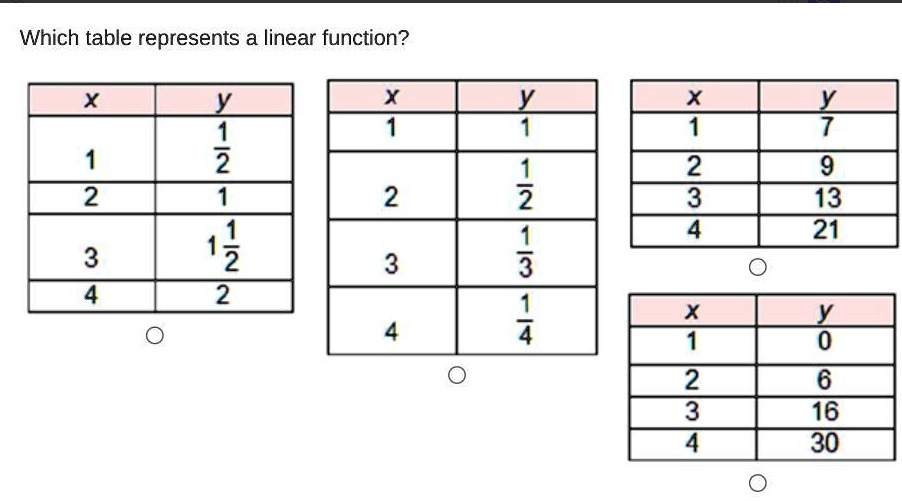
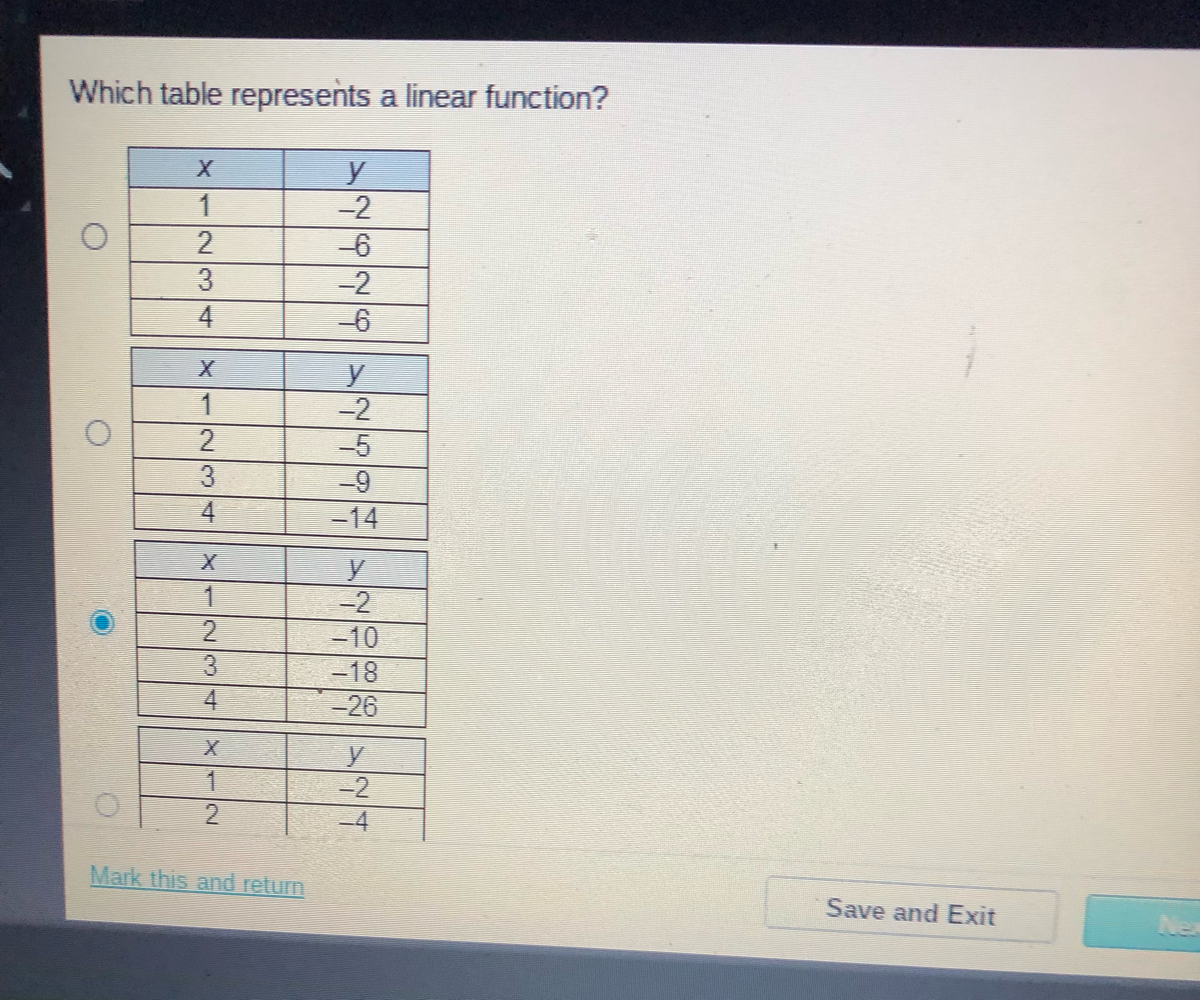
Which Table Represents A Linear Function

Okay, so you're staring at a bunch of tables, each filled with numbers that seem to dance randomly. And the question is: which one shows a linear function? Don't sweat it! Think of it like this: a linear function is just a super predictable friend. You know, the one who always orders the same thing at the restaurant and arrives exactly five minutes early. No surprises, just consistent behavior. Let's break it down.
First, let's talk about what "linear" actually means. Imagine you're driving. A linear journey means you're cruising at a constant speed. You cover the same distance every hour. No sudden bursts of acceleration, no unexpected stops for that roadside ice cream. Just smooth, steady progress.
The Constant Rate of Change: Our Key to Success
In math terms, that "constant speed" is called the rate of change (or sometimes, the slope). It’s the secret sauce of linear functions. To figure out if a table represents a linear function, we need to check if this rate of change is consistent. Think of it like this: if you're paying your friend back for pizza, a linear agreement would be paying the same amount each week until it's all squared away. No suddenly doubling the payment, no skipping weeks because you "forgot."
Must Read
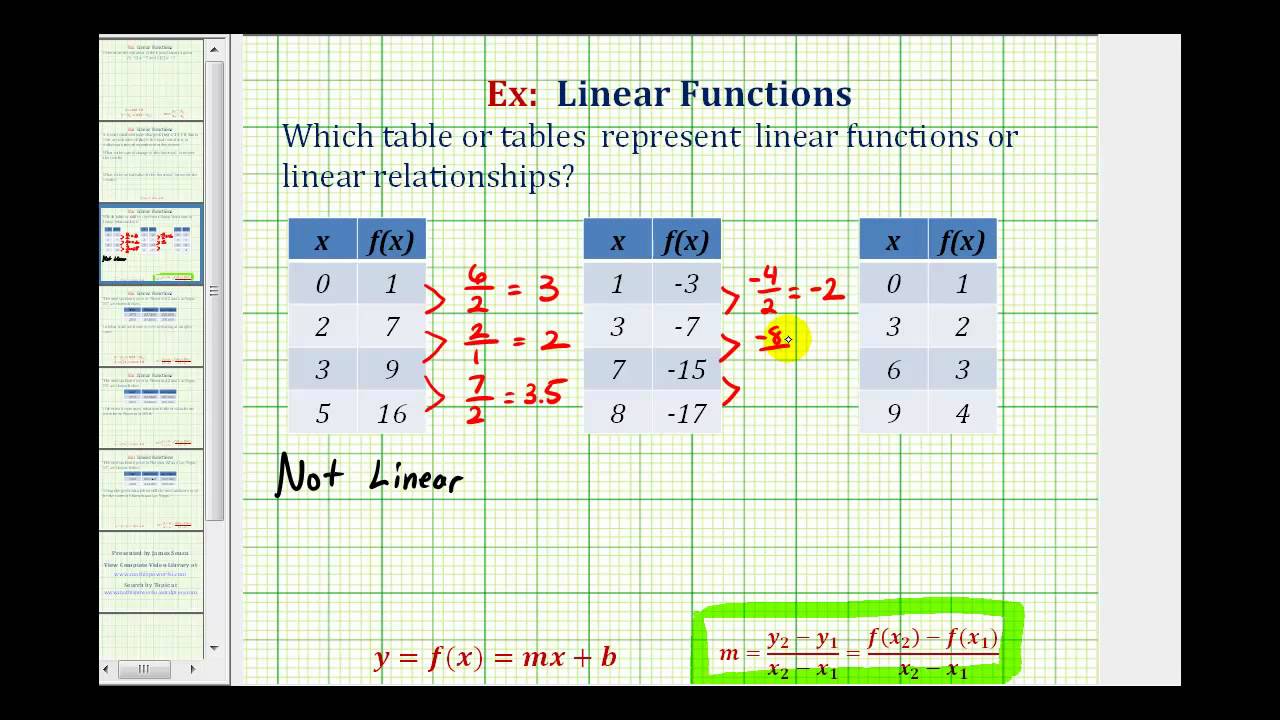
Here’s how to find the rate of change. Pick any two rows from the table. Let’s say you have x and y values. Subtract the y values (that's the "change in y") and divide by the difference of the corresponding x values (that's the "change in x"). Formulaically (if you're into that sort of thing):
Rate of Change = (Change in Y) / (Change in X) = (Y2 - Y1) / (X2 - X1)
Do that for a few different pairs of rows in the table. If you get the same number every time, congratulations! You've found a linear function! If the rate of change is all over the place, like your internet speed when everyone's streaming movies, then the table doesn't represent a linear function.
Example Time! (With a Touch of Humor)
Let's say we have this table:
X | Y
1 | 3
2 | 5
3 | 7
4 | 9
Let's pick the first two rows. Change in Y is 5 - 3 = 2. Change in X is 2 - 1 = 1. So, the rate of change is 2/1 = 2.
Now, let's try the last two rows. Change in Y is 9 - 7 = 2. Change in X is 4 - 3 = 1. The rate of change is still 2/1 = 2.
See? It's consistent! This table shows a linear function. You can almost hear it whispering, "I'm predictable, and I'm proud!"
Now, imagine a table like this:
X | Y
1 | 2
2 | 4
3 | 8
4 | 16
If you calculate the rate of change, you'll see it's all over the map. This is like your friend who says they'll be there at 7, shows up at 8:30, and then blames it on "traffic" (even though they live next door). Not linear at all! More like exponentially flaky.

Common Pitfalls (and How to Avoid Them)
One common mistake is forgetting to keep the order consistent. If you do Y2 - Y1, you must do X2 - X1. No mixing and matching! It's like trying to put ketchup on your ice cream. Just… don't.
Another trap is assuming that if the Y values are increasing (or decreasing), it's automatically linear. Nope! They need to increase (or decrease) by the same amount for each consistent change in X.
In summary: Find the rate of change between different pairs of points. If it’s the same every time, you’ve got yourself a linear function. If not, move on to the next table. And remember, being predictable (like a linear function) isn’t always a bad thing… especially when it comes to math problems!