How Do You Check Crime Rate In An Area

Okay, so picture this: I was once super excited about a potential new apartment. It was on a really cute, tree-lined street, looked great online, and was surprisingly affordable. My friend, ever the cautious one, asked, "Did you check the neighborhood crime rate?" My immediate thought was, "Uh, yeah? It feels safe." Which, let's be honest, is about as scientific as deciding your dinner based on the color of your socks. We all get that gut feeling, right? But when it comes to something as important as where you live, "a feeling" isn't exactly the most reliable data point.
It got me thinking: how do you actually check crime rates in an area? Not just vaguely wonder, but actually get some solid, verifiable information? Because, trust me, just asking your cousin's friend's dog walker isn't going to cut it. And you probably want to move beyond just scrolling through ominous Reddit threads, wouldn't you?
Start with the Official Stuff: Police & Government Data
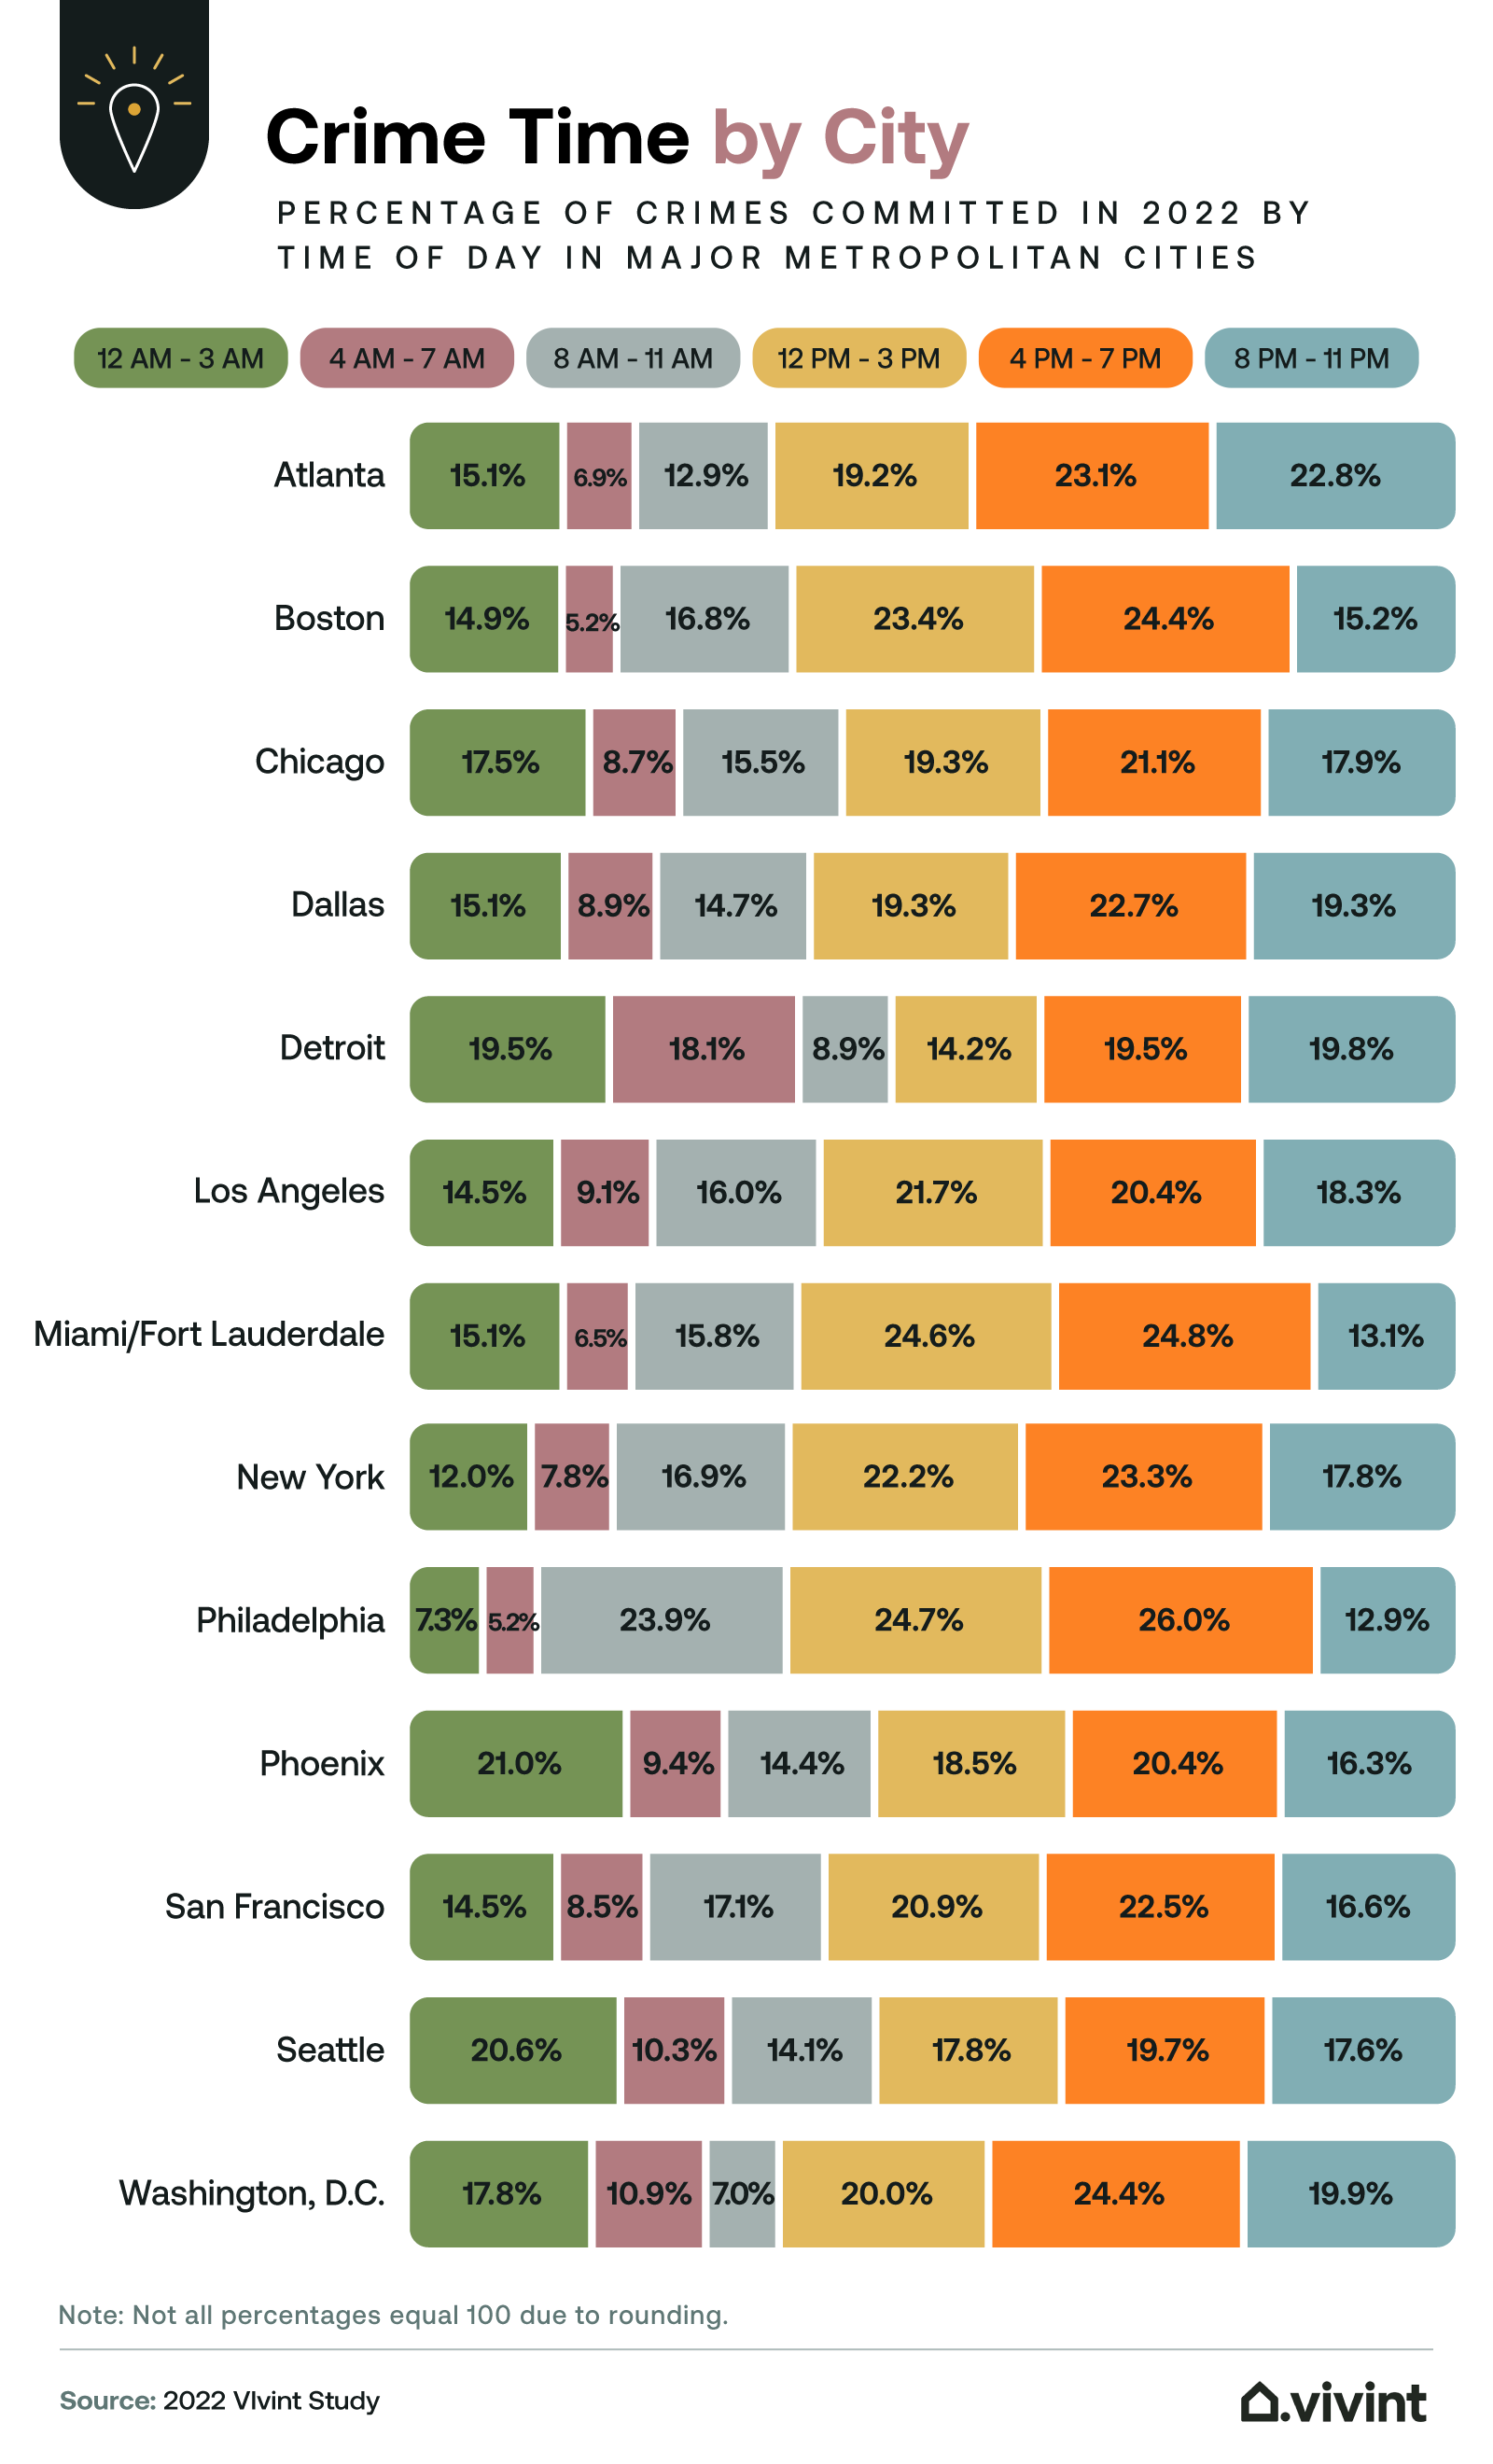
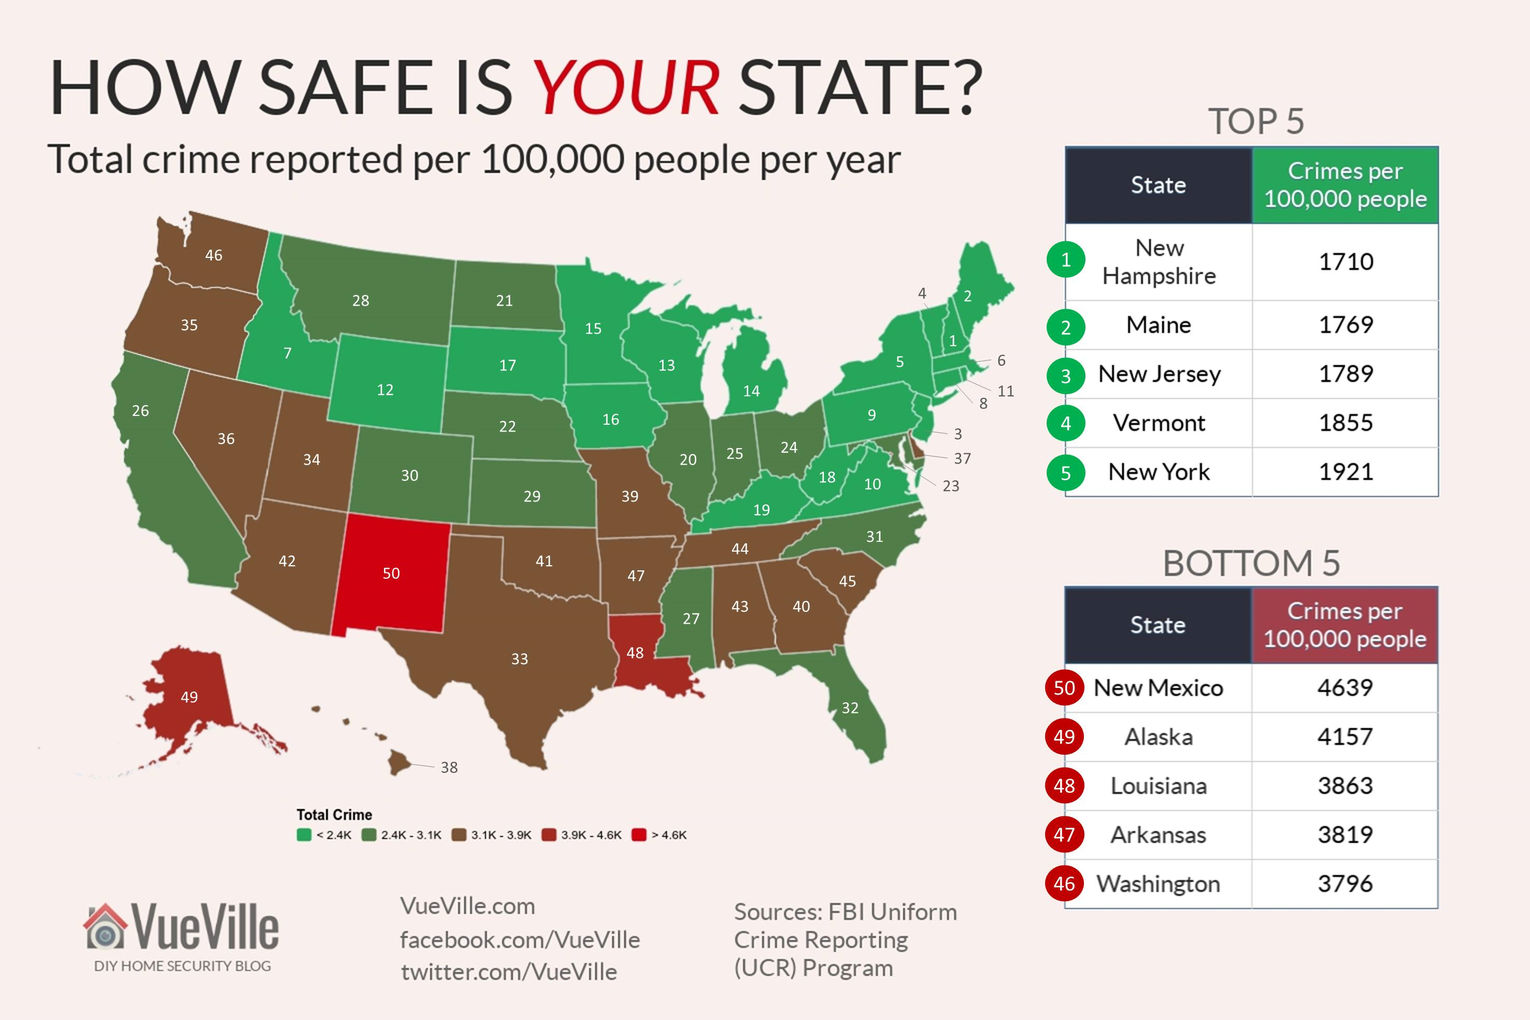
This is your primary source for the most official information, though it can sometimes be a bit dry. Most countries, states, or even cities have systems for tracking crime. In the US, for example, the FBI collects data, but for more granular details, you'll want to dive into local police department websites. Seriously, give it a try!
Must Read
Many departments now offer interactive crime maps, incident logs, or annual reports directly on their sites. You can often filter by crime type, date range, and even specific addresses. This is where you get the nitty-gritty: how many burglaries happened on Elm Street last month, or if there's been an uptick in car thefts nearby.
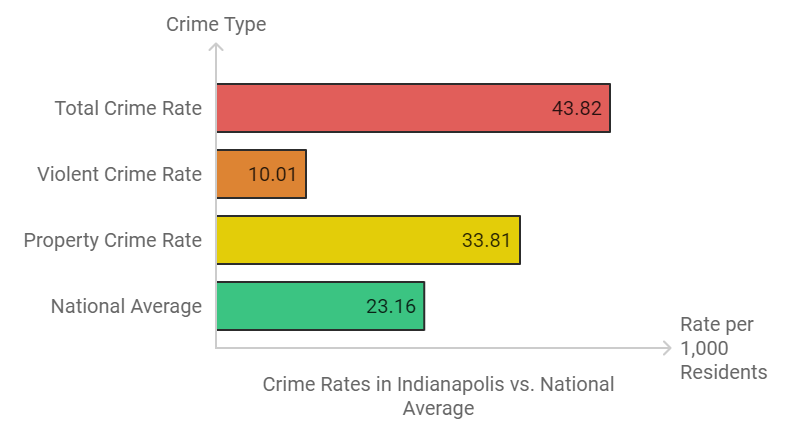
Pro tip: Don't just look at the raw numbers. Look at the context. A big city will naturally have more incidents than a tiny rural town, but what's the rate per capita? That’s your real comparison point.
Third-Party Crime Maps & Websites
Navigating government websites can sometimes feel like deciphering ancient hieroglyphs, right? No worries! There are plenty of fantastic third-party sites and apps designed to make this easier.
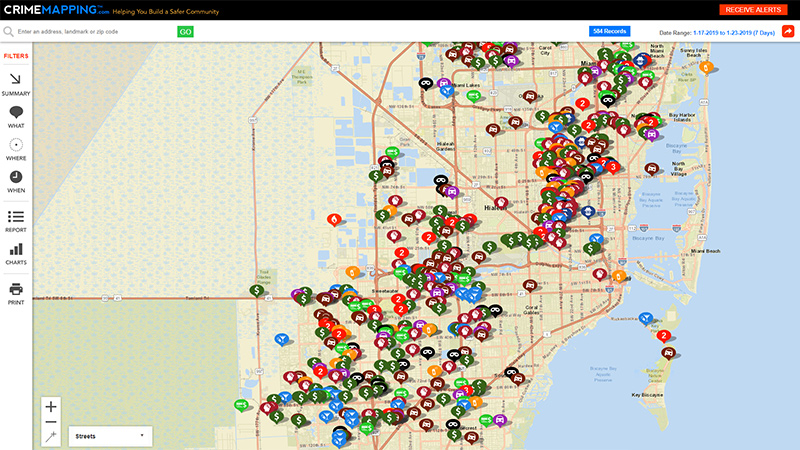
Websites like CrimeMapping.com, SpotCrime, or even NeighborhoodScout (though some features might be premium) aggregate public crime data and present it in user-friendly, visual ways. Just plug in an address or zip code, and boom – a map pops up with icons representing different types of crimes. It’s super helpful for getting a quick visual sense of an area's activity.
A word of caution, though: These sites draw from official reports, but there can be a slight delay in updates. Also, a single car break-in shown on a map doesn't mean the area is a warzone. It just means an incident happened. Don't let a few red dots send you into a panic spiral without digging deeper!
Community Forums & Local News
While not "data" in the statistical sense, these sources offer invaluable qualitative insights. Dive into local Facebook groups, Nextdoor, or even the comments section of your local newspaper's website (if you dare!). You'll often find residents discussing ongoing issues or celebrating neighborhood watch successes.
Sometimes, what people are talking about can tell you as much as official stats. Are they constantly complaining about petty theft from porches? Or is the biggest "crime" a debate over who gets to use the community garden plot? It paints a picture, you know?
My take: Use these as a temperature check, not your sole source of truth. People love to vent online, and a single incident can sometimes get blown way out of proportion. Balance it with official numbers.
Old-School Recon: Walk Around!
Honestly, this is still one of the most powerful tools in your arsenal. After you've done your digital digging, go and experience the area firsthand. Walk around at different times of day – morning, afternoon, and evening. What's the vibe?
- Are people out and about?
- Are properties well-maintained or neglected?
- How well-lit are the streets at night?
- Do you feel comfortable?
This is where your initial "gut feeling" comes back into play, but this time, it's an informed gut feeling, backed by data. You've done your homework, now let your senses confirm or challenge what you've learned.
Talk to the Locals
Who better to give you the real lowdown than the people who live there? Strike up a friendly conversation with someone at the local coffee shop, the person walking their dog, or a shop owner. Ask them about their experiences. "What's it like living here?" "Any issues people worry about?" You'd be surprised how open people can be when you approach them genuinely.
Of course, everyone's perception is subjective, but getting a few different perspectives can be incredibly helpful. You might hear about specific hotspots to avoid, or discover that a seemingly high crime statistic is actually concentrated in a very specific, isolated area you wouldn't even be near.
Wrapping It Up: Context is King
Ultimately, checking crime rates isn't just about finding a scary-sounding number and running away. It's about gathering information from various sources – official data, mapping tools, community chatter, and your own eyes and ears – and then putting it all into context. Understand the types of crime, the frequency, and the geographical spread.
Every area has some level of crime; that's just a sad reality. The goal isn't to find a mythical crime-free paradise, but to make an informed decision that aligns with your comfort level and priorities. So go forth, be curious, do your homework, and make choices that make you feel safe and sound. Happy investigating!