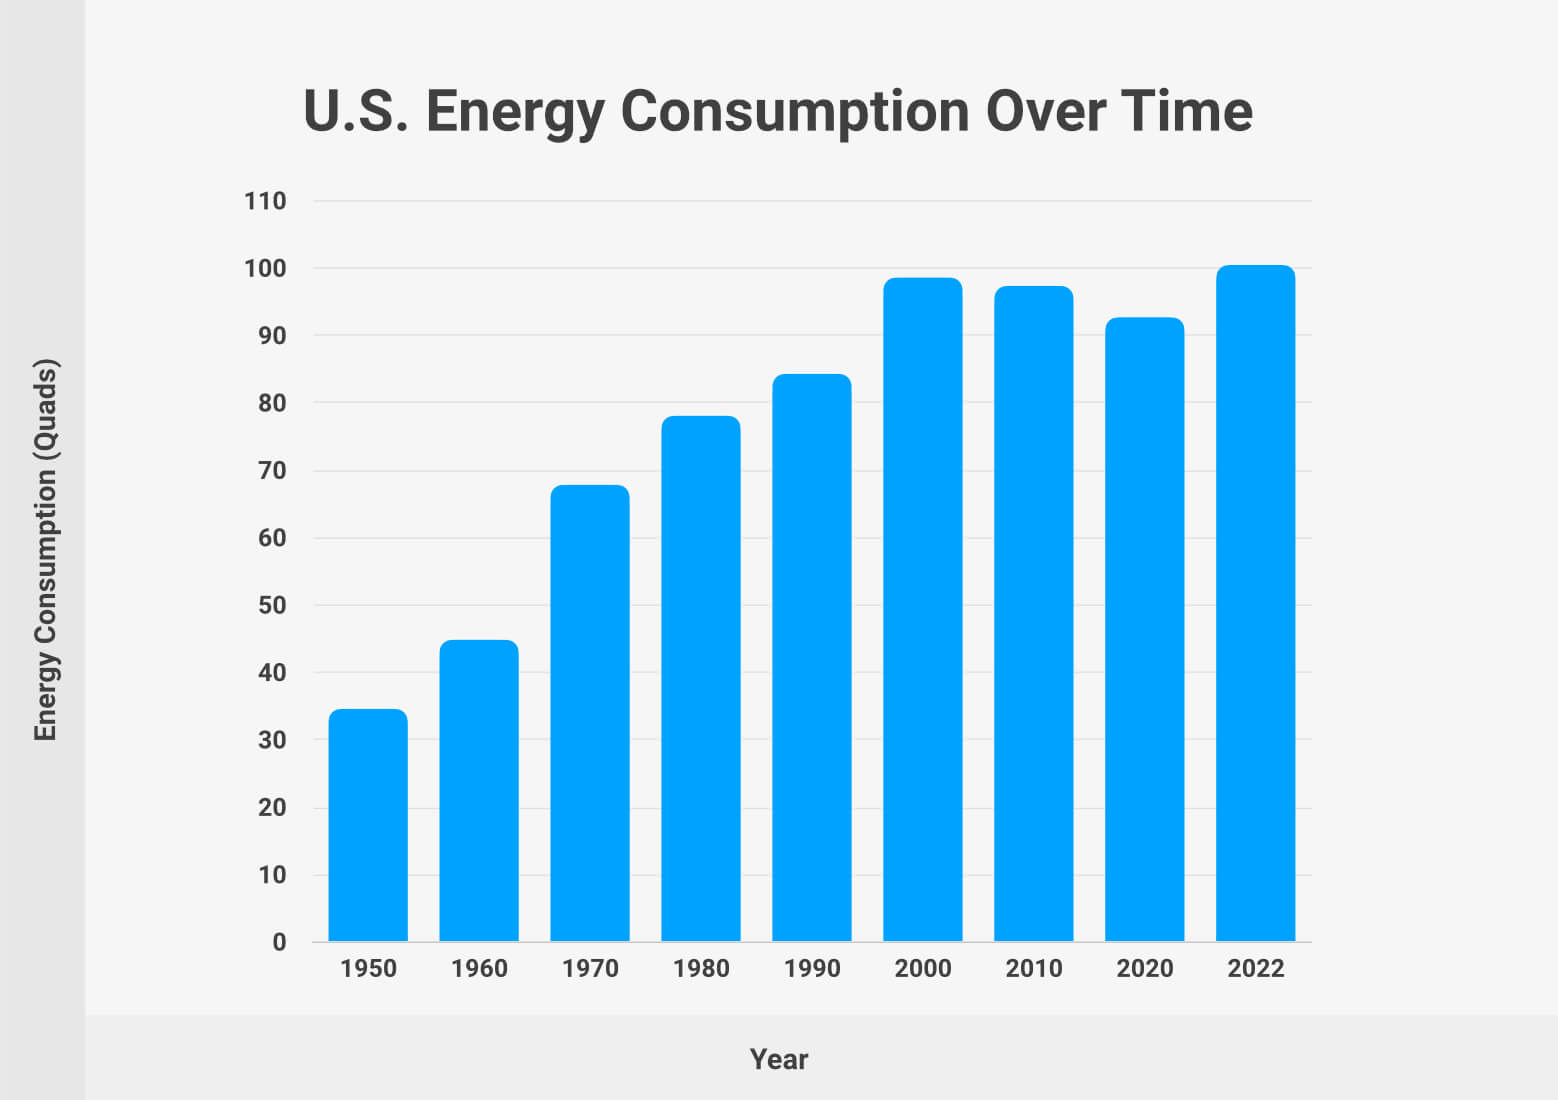
United States Annual Energy Consumption
Think about your day. From the moment your alarm clock buzzes (powered by electricity!) to your morning coffee brewing, your commute to work or school, scrolling on your phone, and streaming your favorite show at night – energy is the invisible force making it all happen. Now, multiply that by over 330 million people, countless businesses, and a whole lot of industry, and you start to get a sense of the truly massive scale of the United States' annual energy consumption. It might sound like a dense topic, but understanding this national energy pulse is actually incredibly insightful, useful, and even a little bit fun!
Why should we care about something as seemingly abstract as "annual energy consumption"? Well, it's like taking a national X-ray. It gives us a crystal-clear picture of how we live, what drives our economy, and where our priorities lie. The purpose of tracking this data is profound: it helps us understand our impact on the planet, identify areas for efficiency, and strategically plan for the future. By knowing how much energy we use, and more importantly, where it comes from and where it goes, we can make smarter decisions about everything from national policy to the kind of lightbulbs we buy.
The benefits are widespread. For policymakers, it's a vital tool for crafting energy policies that promote sustainability, energy independence, and economic growth. For businesses, it highlights opportunities for innovation in renewable technologies or energy-saving products. And for you, the everyday citizen, it fosters a deeper appreciation for the complex web that powers your life, empowering you to make more informed choices about your own energy footprint. It’s not just numbers on a chart; it’s a living, breathing story of our nation's progress and potential.
Must Read
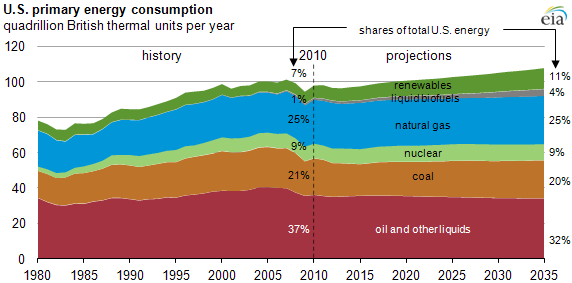
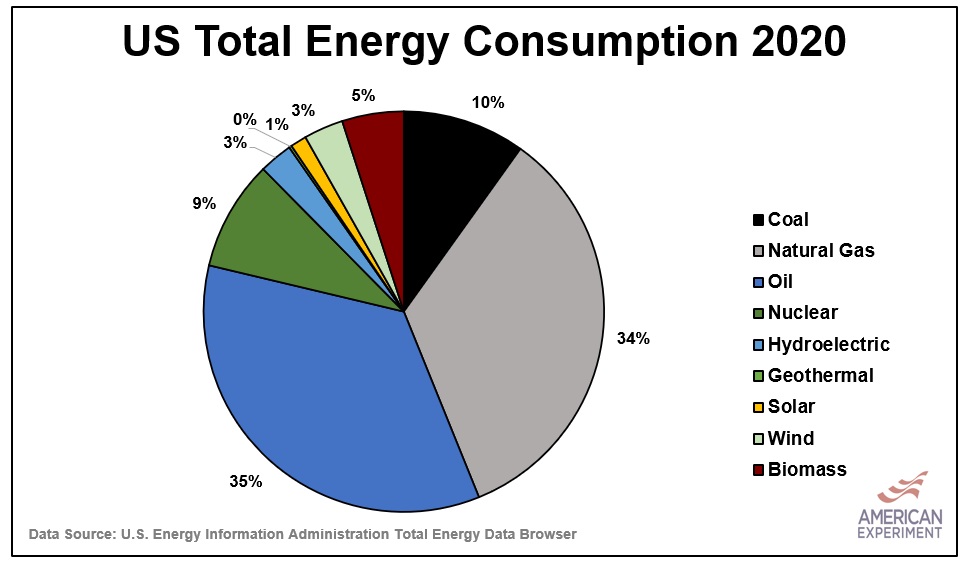
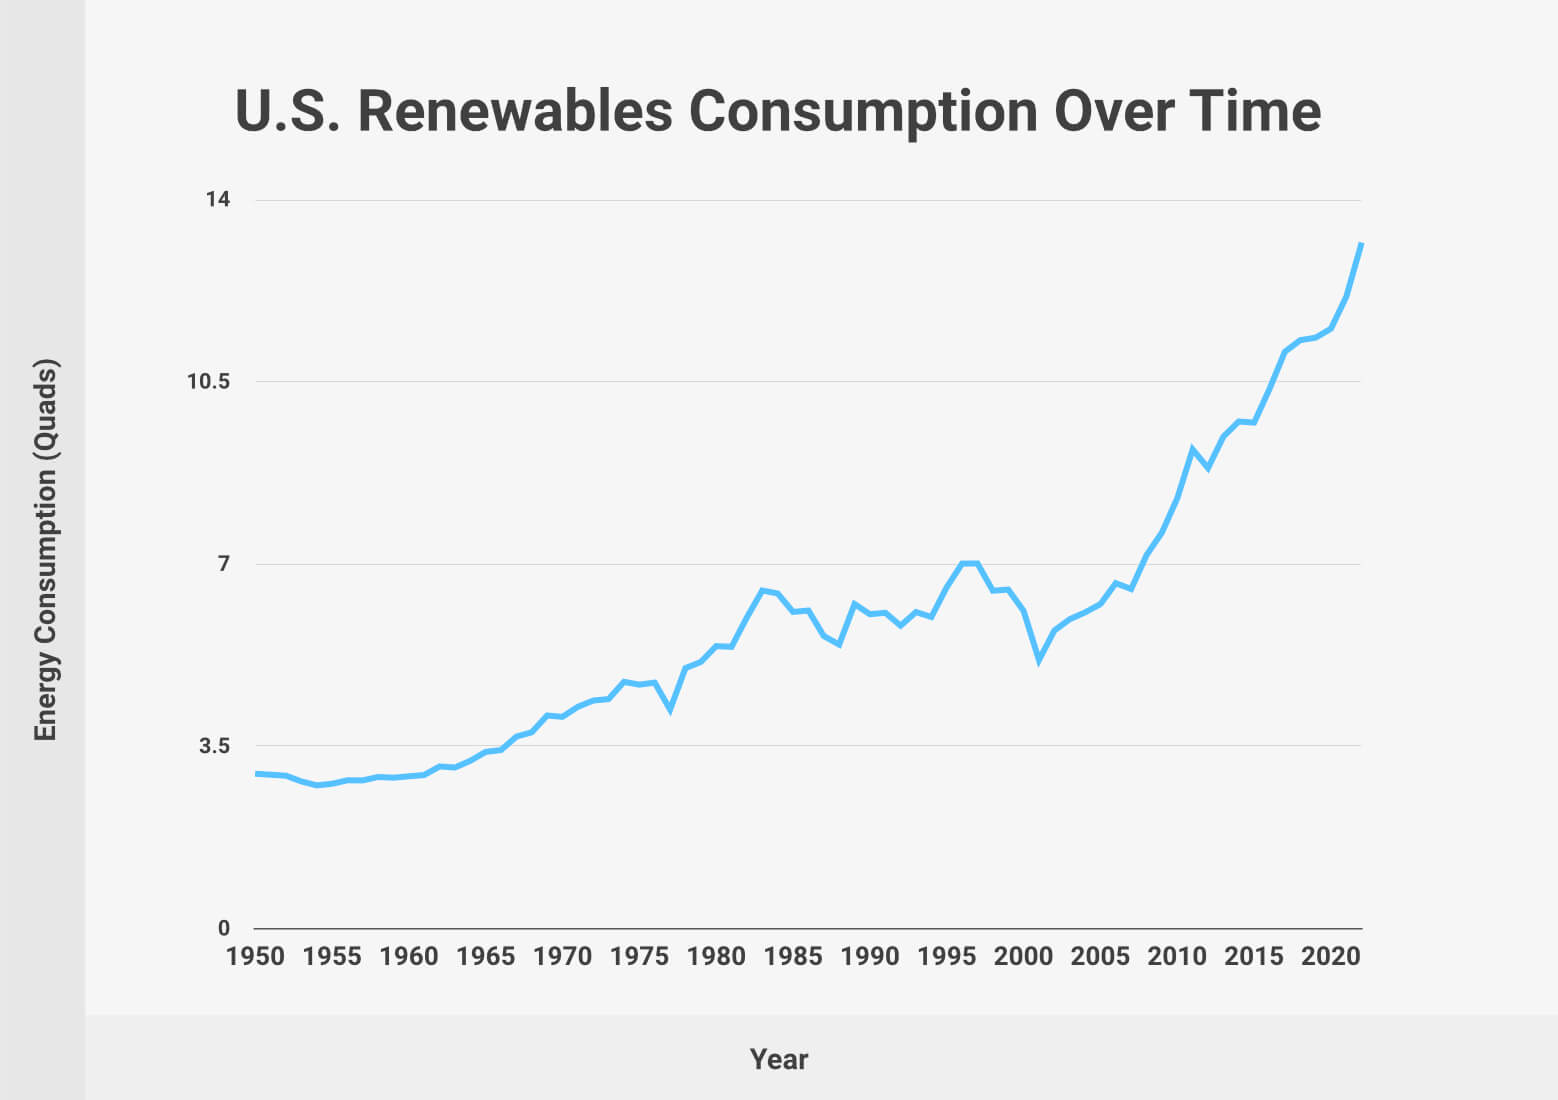
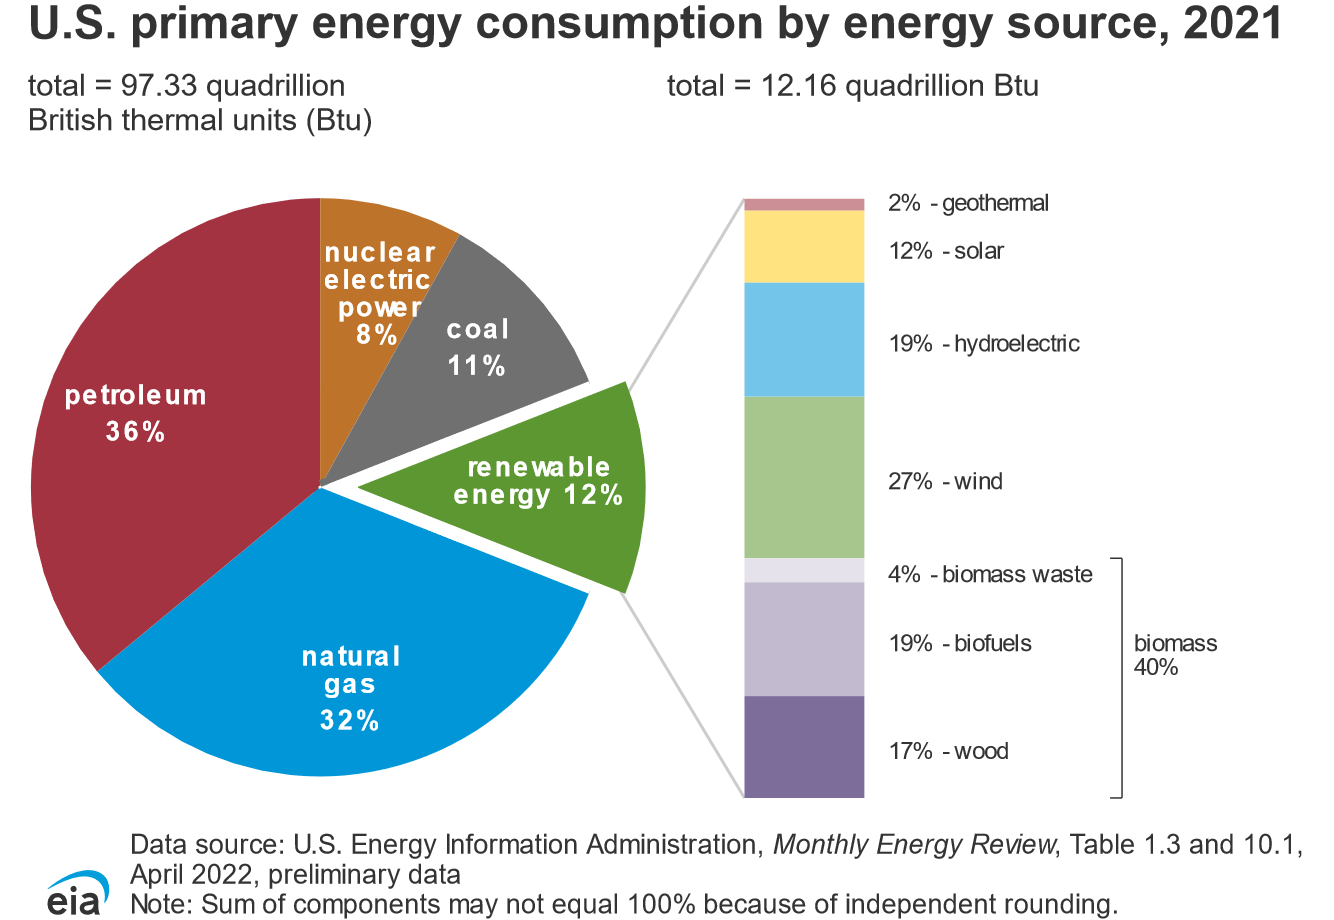
So, what does this energy picture typically look like for the U.S.? It's a diverse mix! We rely on a blend of energy sources, traditionally dominated by fossil fuels like petroleum (for transportation, primarily), natural gas (heating and electricity), and coal (electricity). But here’s where it gets really interesting: the share of renewable energy sources – think solar, wind, hydropower, and geothermal – is growing at an exciting pace! This shift reflects a collective effort to move towards cleaner, more sustainable energy solutions. We also factor in nuclear power, a significant contributor to carbon-free electricity.
Tracking annual energy consumption isn't just about recording data; it's about observing dynamic trends. Are we becoming more efficient? Is our energy mix getting greener? How does population growth and technological advancement influence our demand? Every year, these figures tell a compelling story about our collective journey. It’s a powerful metric that shows us where we’ve been, where we are, and provides an essential roadmap for where we need to go to ensure a bright, sustainable future for generations to come. It truly is a topic that impacts every single one of us, every single day.