How To Add A Total Row In Access

Ever felt like your Access table was just...missing something? Like a punchline to a really long spreadsheet joke? That's probably because you haven't discovered the magic of the Total Row!
Think of it as the grand finale, the curtain call, the "and now for the important bit" of your data presentation.
Here's how you can conjure this statistical wonder into existence.
Must Read
Summoning the Total Row
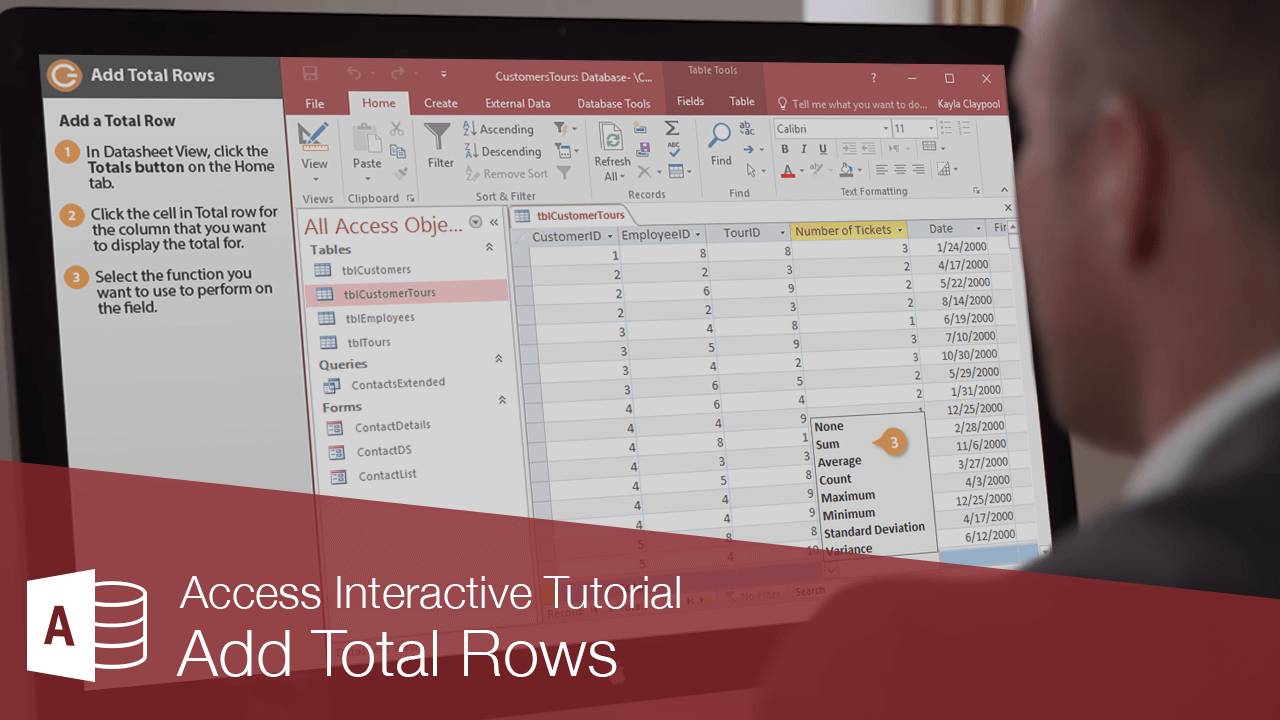
First, open your table in Datasheet View. It's the view that looks like a spreadsheet, all organized and ready to go.
Next, look for the Home tab. It's usually at the top of the Access window, nestled among the other tabs like Create and External Data.
Click on the Home tab, and then scan the ribbon for the Totals button. It usually lives in the Records group, and looks like a capital sigma (Σ) – the mathematical symbol for summation. Kind of like a sophisticated "add 'em up!" signal.
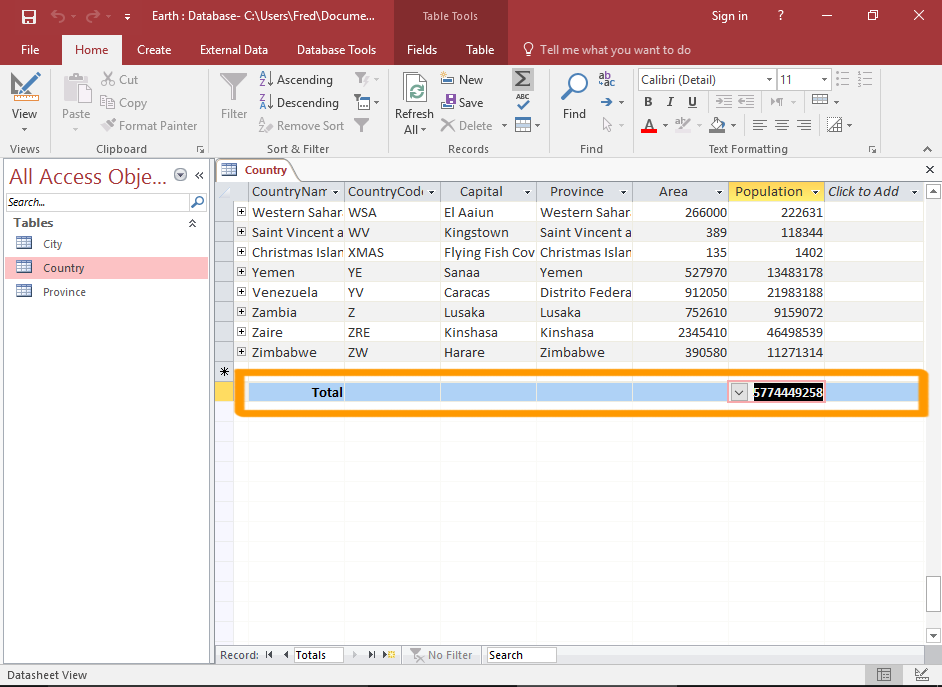
Click that magical Totals button! Boom! A brand new row appears at the bottom of your table, like a surprise encore performance.
The Total Row: More Than Just Sums
Now, don't let the name fool you. This row isn't just about sums. It's a versatile little fellow.
Click in any cell of the new total row, and you'll see a dropdown arrow appear. It's like a tiny, data-savvy genie granting your statistical wishes.
Click on that arrow and behold the possibilities! You'll see a list of functions, like Sum, Avg (average), Count, Min (minimum), Max (maximum), and more.
Pick your poison! Do you want to know the sum of all the sales figures? Select Sum. Curious about the average order value? Choose Avg.
Need to know the highest price? Select Max. Want to see how many orders you processed? Choose Count.
Dealing with Text Fields
Now, you might be thinking, "What about text fields? I can't exactly sum names and addresses!" And you'd be right.
When you click the dropdown in a text field, Access smartly offers you options like Count (to see how many records there are) or functions related to string manipulation in more complex scenarios.
Sometimes, Access might default to "Expression" in a text column. Don't panic! Just select Count. You'll get the number of records.
Customizing Your Totals
Feeling adventurous? You can even create your own custom expressions in the Total row.
Instead of choosing one of the predefined functions, select "Expression" and start typing! You can use Access's built-in functions and operators to perform more complex calculations.
Be careful though! Custom expressions can be a bit tricky. Make sure you know what you're doing, or you might end up with some unexpected results.
Hiding the Total Row
Finished admiring your handiwork? Need to reclaim some screen space? You can easily hide the Total row.
Simply click the Totals button again (the one you used to summon it in the first place). It acts like a toggle switch, turning the Total row on and off.
Poof! Gone! But don't worry, it's not gone forever. Just click the Totals button again to bring it back.
Total Row Etiquette
A word of caution: the Total Row isn't always appropriate. Sometimes, it can be downright misleading.
For example, summing product IDs or customer numbers doesn't usually make sense. It's like adding apples and oranges – you end up with a meaningless fruit salad.
Use your judgment! Make sure the totals you're displaying are actually useful and relevant to your data.

The Total Row: A Data Detective's Secret Weapon
Think of the Total Row as a magnifying glass for your data. It allows you to quickly zoom in on key statistics and uncover hidden patterns.
It's a powerful tool for data analysis, reporting, and decision-making.
So, go forth and explore the wonders of the Total Row! May your tables be ever insightful, and your data always reveal its secrets.
Beyond the Basics
While we've covered the core functionality of the Total Row in datasheet view, it's important to remember that this is just the tip of the iceberg. Access offers far more sophisticated ways to perform calculations and summaries.
For more advanced analysis, consider using queries. Queries allow you to filter, sort, and group your data, and then perform calculations on those groups.
They offer greater flexibility and control than the Total Row, and are essential for creating complex reports.
Reports and the Total Row
Speaking of reports, Access reports provide even more powerful tools for displaying summarized data. You can easily add totals, averages, and other calculations to your reports using the report designer.
Reports offer a wide range of formatting options, allowing you to create professional-looking documents that effectively communicate your findings.
Learn more about reports to elevate your Access game to the next level.
A Real-World Example
Imagine you're running a small online store. You use Access to track your sales data, including product names, prices, and quantities sold.
Using the Total Row, you can quickly see the total revenue generated by each product, the average order value, and the number of units sold.

This information can help you make informed decisions about pricing, inventory management, and marketing strategies.
The Emotional Side of Data
Believe it or not, there's an emotional side to data. Seeing the total revenue generated by your hard work can be incredibly satisfying.
Discovering that a particular product is performing exceptionally well can be a huge confidence booster.
Data isn't just numbers; it's a reflection of your efforts, your successes, and your potential.
Embrace the Power of Access
Access might seem like a humble database program, but it's a powerful tool for organizing, analyzing, and understanding your data.
The Total Row is just one small feature, but it can make a big difference in how you work with your data.
So, embrace the power of Access, explore its many features, and unlock the hidden potential of your data.
Total Row Limitations
It’s important to understand that Total Row functionality, while convenient, has limitations.
It’s not suitable for complex calculations requiring multiple steps or conditional logic, and can be limiting for custom data groupings.
Remember its simplicity as a starting point, not the ultimate solution for all summarization needs.
Data Integrity and the Total Row
Always double-check your data before relying heavily on the Total Row. Inaccurate data in your tables will inevitably lead to incorrect totals, diminishing their usefulness.
Regularly audit your data for errors and inconsistencies to ensure the reliability of your totals.
Garbage in, garbage out – a golden rule of data management.
The Joy of Discovery
The best part about working with data is the joy of discovery. The moment when you uncover a hidden trend, identify a problem, or validate a hypothesis.
The Total Row can be a valuable tool in this process, helping you to quickly explore your data and identify potential areas of interest.
So, keep exploring, keep questioning, and keep learning. The world of data is full of surprises waiting to be discovered.
Sharing Your Insights
Once you've uncovered some valuable insights from your data, don't keep them to yourself! Share them with others.
Use your findings to inform decisions, improve processes, and drive positive change.
Data is most powerful when it's used to make a difference in the world.
Total Row: Not Just for Numbers
While the Total Row is often used for numerical calculations, it can also be helpful for analyzing text data. For instance, using the `Count` function on a field with customer feedback allows you to quickly quantify sentiment.
Explore the different functions available to see how they can be applied to your specific data.
A little creativity can unlock unexpected insights from even seemingly simple features.