How Do You Find The Crime Rate In An Area

So, you want to know the crime rate in an area, huh? Perhaps you're moving. Maybe you're visiting. Or maybe you're just a nosy neighbor, and let's be honest, who isn't a little curious? It feels like it should be easy, right? Like finding the nearest coffee shop or the best pizza place. Spoiler alert: it's not always as straightforward as ordering a double-shot latte with oat milk.
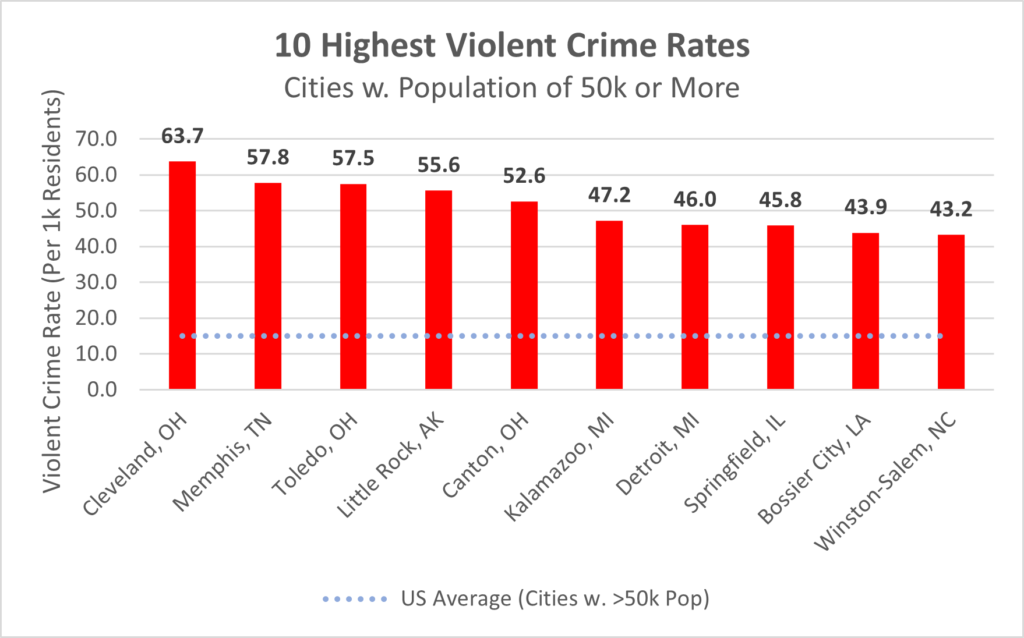
Your first thought, quite reasonably, might be to go straight to the source. The official guys! Law enforcement! You'd head over to the FBI's Uniform Crime Reporting (UCR) Program or maybe the National Incident-Based Reporting System (NIBRS). Sounds official, sounds comprehensive. You'll find pages of data, tables, and acronyms that could make your head spin faster than a child on a sugar rush. They break it down by violent crime, property crime, and give you raw numbers or rates per 100,000 residents. It's serious stuff.
Then you try your local police department's website. They often have shiny dashboards or annual reports. Great! But sometimes, these reports are drier than a forgotten cracker. They might tell you crime went up 2% last year, or down 5%. But what does that actually mean for the specific block you're considering? Is that 2% increase because someone stole a garden gnome, or because there was a surge in actual scary stuff? The raw numbers are useful for city planners and policymakers, but for your personal gut feeling about safety? Not always so much.
Must Read
You might then turn to third-party websites. These are the friendly-looking sites that promise to give you "neighborhood stats" and "safety scores." They often have pretty maps with heat gradients. Green means good, red means... well, you know. They pull data from various sources, trying to make sense of the official numbers. They might even give you a letter grade for safety. Which is handy, until you realize that one site's "B+" is another site's "C-". It’s like Yelp reviews for crime, but less consistent.
These sites can be a good starting point, for sure. They aggregate data and present it in a digestible way. But remember, they're often generalizing. A whole zip code might be painted with one brush, even if one end is bustling with trendy cafes and the other is... less so. They rely on reported crime, and not all crimes are reported. And sometimes, their data can be a little behind, like that one friend who still thinks flip phones are cool.
The Unofficial, Slightly Unconventional, Yet Surprisingly Effective Methods
Now, here's where my "unpopular opinion" comes in. While the official numbers are absolutely vital for big-picture analysis, for your personal "is this neighborhood for me?" question, you might need to embrace some less scientific, more street-smart approaches. Call it the "vibe check".
First, the "Eyeball Test". Take a walk around the area. Seriously. What do you see? Are businesses boarded up? Is there a lot of litter? Are people out and about at different times of day? Do they look relaxed or hurried? Are there kids playing? Are porch lights on? This gives you an immediate, visceral sense of the place. Your subconscious mind is a powerful data processor, absorbing hundreds of tiny clues.

Next, the "Coffee Shop Confessional". Or the bar, or the local park. Find a friendly face – a barista, a local shop owner, someone walking their dog. Strike up a casual conversation. Ask them, "What's it like living here?" or "Any concerns about this area?" Locals are a goldmine of information. They live it every day. They know the nuances the big data sets miss. They might not give you statistics, but they'll give you something arguably more valuable: lived experience.
Then there's the "Social Media Snoop". Local Facebook groups, community forums, or even Nextdoor can be incredibly telling. People there often post about anything and everything – lost pets, block parties, and yes, sometimes, crime. You'll hear about recent incidents, ongoing concerns, and local gossip that paints a very granular picture. Just be prepared for a mixed bag of opinions and remember to filter for genuine concerns versus hyperbole.

Finally, the "Real Estate Agent Reveal." While they won't tell you, "This street is full of petty thieves," they are often good at subtly guiding you. They might say things like, "This part of town has a real sense of community," or "It's very quiet after dark here." Read between the lines. Their job is to sell, but they also have a reputation to uphold, and they often know the local lay of the land better than anyone.
Sometimes, the best crime rate indicator isn't a government database, but your own two feet and a friendly chat.
So, how do you find the crime rate in an area? You do all of it. Start with the official numbers to get a baseline. Then, dive into the anecdotal, the visual, and the local wisdom. Because ultimately, what you're really looking for isn't just a number, it's a feeling. It's about whether you'll feel safe and comfortable enough to call that place home. Happy sleuthing!