How To Find Height Of Density Curve

Let's face it, statistics can sometimes feel like deciphering ancient hieroglyphics. But today, we're going to tackle a surprisingly fun and useful concept: finding the height of a density curve! Think of it as being a data detective, uncovering secrets hidden within the shape of a graph. Why is this fun? Because it unlocks a deeper understanding of how data is distributed and helps us make more informed decisions.
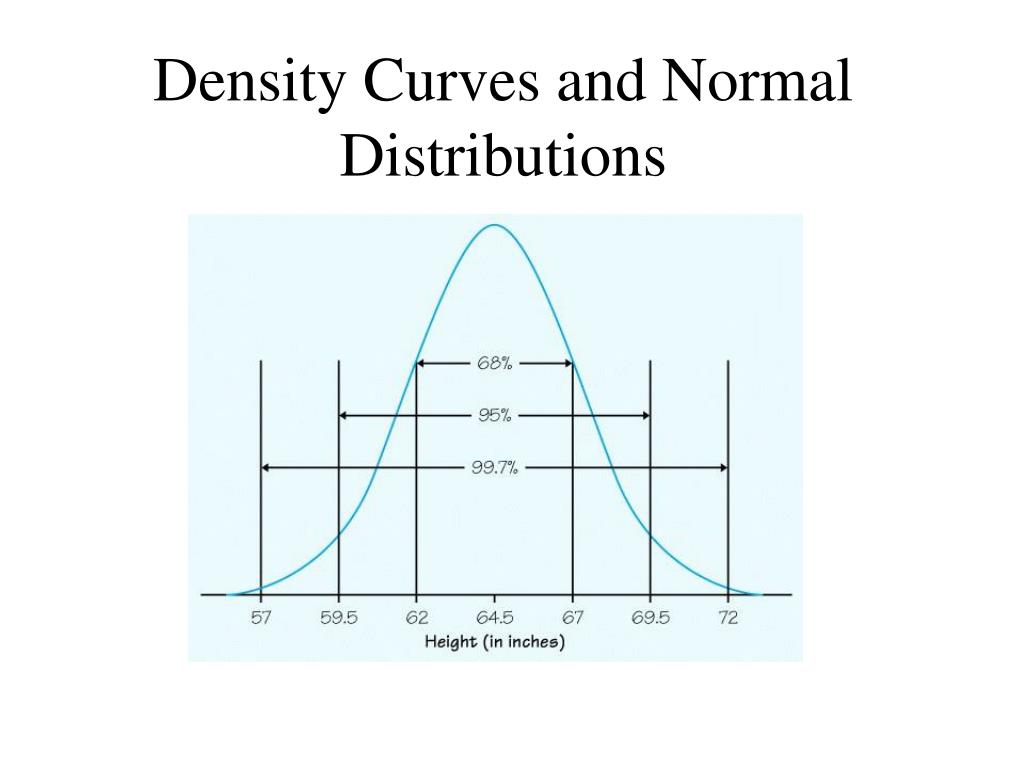
So, what exactly is a density curve, and why should you care about its height? A density curve is essentially a smoothed-out histogram. It's a graphical representation of the distribution of a continuous variable – things like heights, weights, temperatures, or even test scores. The shape of the curve tells us a lot about where the data tends to cluster and how spread out it is. Finding the height at a specific point on the curve helps us determine the relative frequency or probability density at that point. In simpler terms, it tells us how likely a particular value is compared to other values.
The purpose of understanding density curve height boils down to better understanding probability. Imagine you're analyzing the distribution of customer ages for a new product. By knowing the height of the density curve at, say, age 30, you can estimate how common customers around that age are compared to customers who are much younger or older. This information is invaluable for targeted marketing, product development, and resource allocation. The benefits are numerous: from risk assessment in finance to quality control in manufacturing, density curve analysis helps us make better predictions and informed decisions.
Must Read
Now, let's get to the practical part: how do we actually find the height? The method depends on whether you have a known theoretical distribution (like a normal distribution) or just raw data.

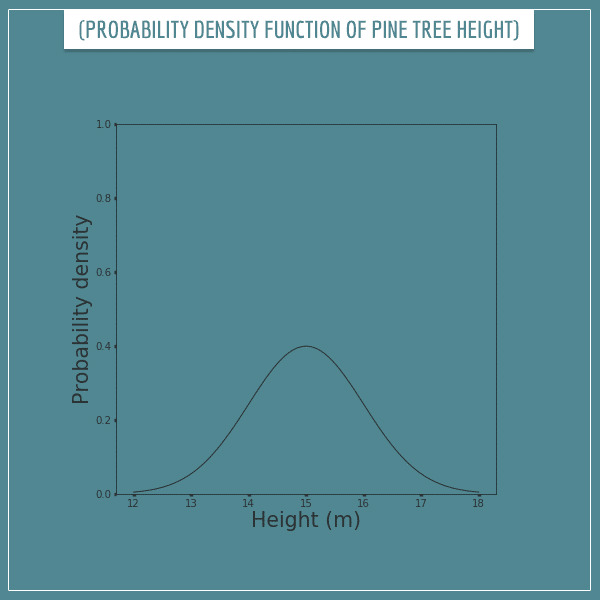
1. Theoretical Distributions: If you know the type of distribution (e.g., normal, exponential) and its parameters (like mean and standard deviation), you can use the probability density function (PDF). Don't let that jargon scare you! The PDF is just a formula that spits out the height of the curve for any given value. Most statistical software packages (like R, Python with libraries like NumPy and SciPy, or even Excel with some add-ins) have built-in functions to calculate the PDF for common distributions. You simply plug in your value and the parameters, and voila! You have the height.
2. Empirical Data: If you only have raw data, you'll need to estimate the density curve first. This is typically done using a technique called kernel density estimation (KDE). KDE creates a smooth curve based on your data points. Again, statistical software comes to the rescue! Functions like `density()` in R or `gaussian_kde` in SciPy (Python) will estimate the density curve for you. Once you have the estimated curve, you can evaluate it at any point to find its height. In essence, these functions are doing a lot of the heavy lifting for you.
A word of caution: Remember that the height of a density curve is not a probability itself! To get a probability, you need to calculate the area under the curve over a specific interval. The total area under the entire density curve is always equal to 1.
So, there you have it! Finding the height of a density curve might seem daunting at first, but with the right tools and a little understanding, it's a powerful technique for uncovering the stories hidden within your data. Go forth and explore the shapes of your data distributions! You might be surprised at what you discover.