
Chi Square Test Of Homogeneity
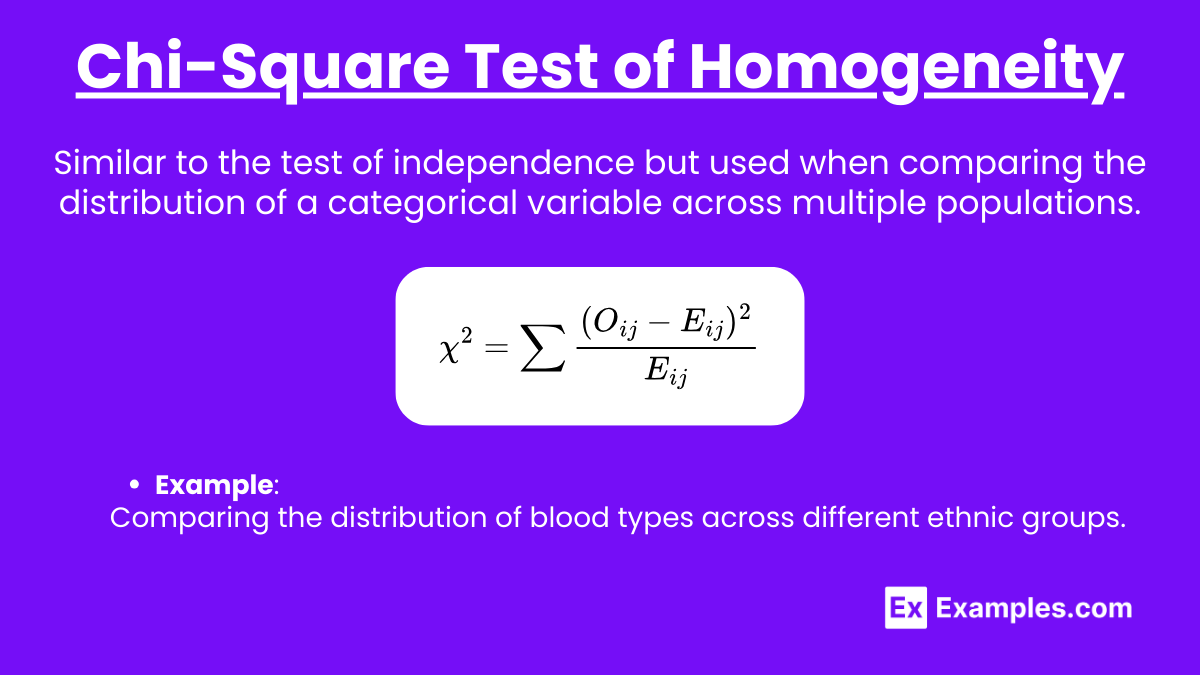
Ever wonder if your taste in music is "normal" for your age group? Or if the reason your friend always picks the winning lottery numbers is, well, more than just luck? Sometimes, we want to know if different groups of people (or things) are actually as different as we think they are. That’s where the Chi-Square Test of Homogeneity swoops in, ready to save the day – or at least, satisfy our curiosity!
Think of it as a detective for patterns, sniffing out whether different populations share similar characteristics. It sounds intimidating, but trust me, it's not as scary as it looks. We'll break it down together, promise!
What on Earth Is Homogeneity?
Okay, let's tackle that big word first. Homogeneity basically means "sameness." So, a test of homogeneity checks if different groups are similar in terms of a specific characteristic. Are they all coming from the same "mold," so to speak?
Must Read
Imagine you’re baking cookies. You make three batches: chocolate chip, oatmeal raisin, and peanut butter. You want to know if the proportion of burnt cookies is the same for each batch. If it is, the batches are homogeneous in terms of burnt-ness (or lack thereof! Hopefully!). If one batch has significantly more burnt cookies than the others, they are not homogeneous.
Why Should I Care?
Good question! You might be thinking, "This sounds like something for scientists in lab coats." But the Chi-Square Test of Homogeneity pops up in everyday life more than you might think. Here are a few fun scenarios where it can be surprisingly useful:
- Marketing Mania: Does a new ad campaign appeal equally to men and women? Businesses use this test to figure out if their marketing is effective across different demographics.
- Political Ponderings: Do different age groups have the same opinion on a political issue? Political analysts use this to understand voting patterns and target their messages.
- Snack Attack: Does your preference for salty vs. sweet snacks change as you get older? I bet you do! Okay, this is just for fun, but you could totally use this test to find out.
The point is, the Chi-Square Test of Homogeneity helps us determine if perceived differences between groups are real or just due to random chance. It's all about sorting out the signal from the noise!
How Does This Magical Test Work? (Without Getting Too Mathy)
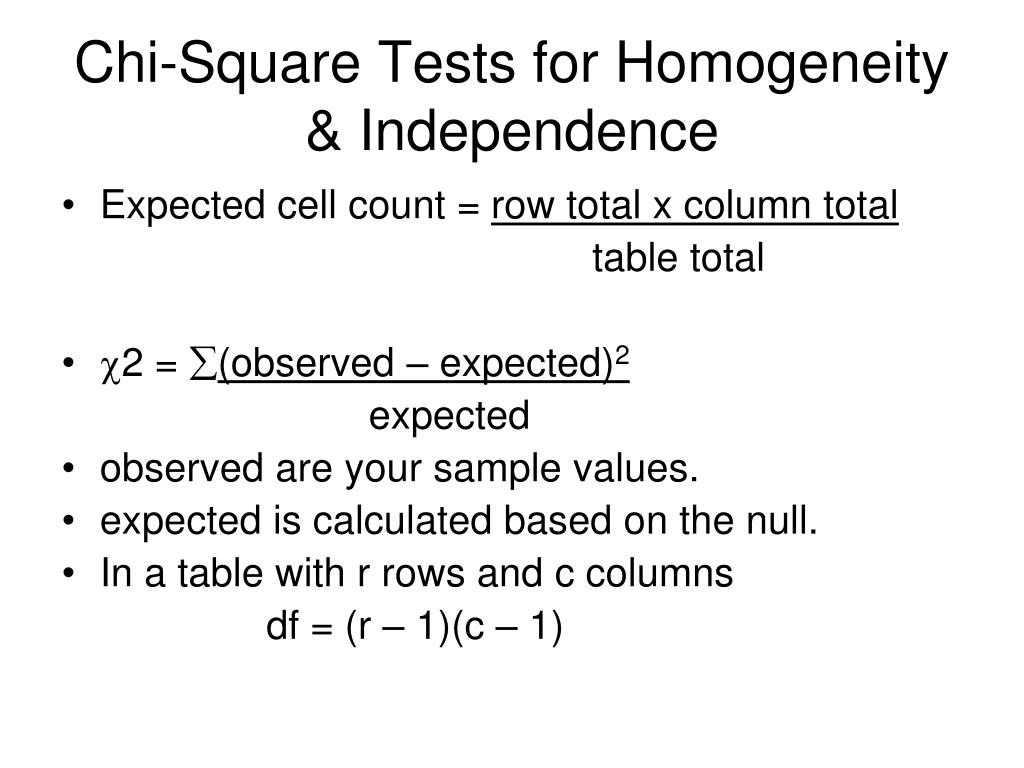
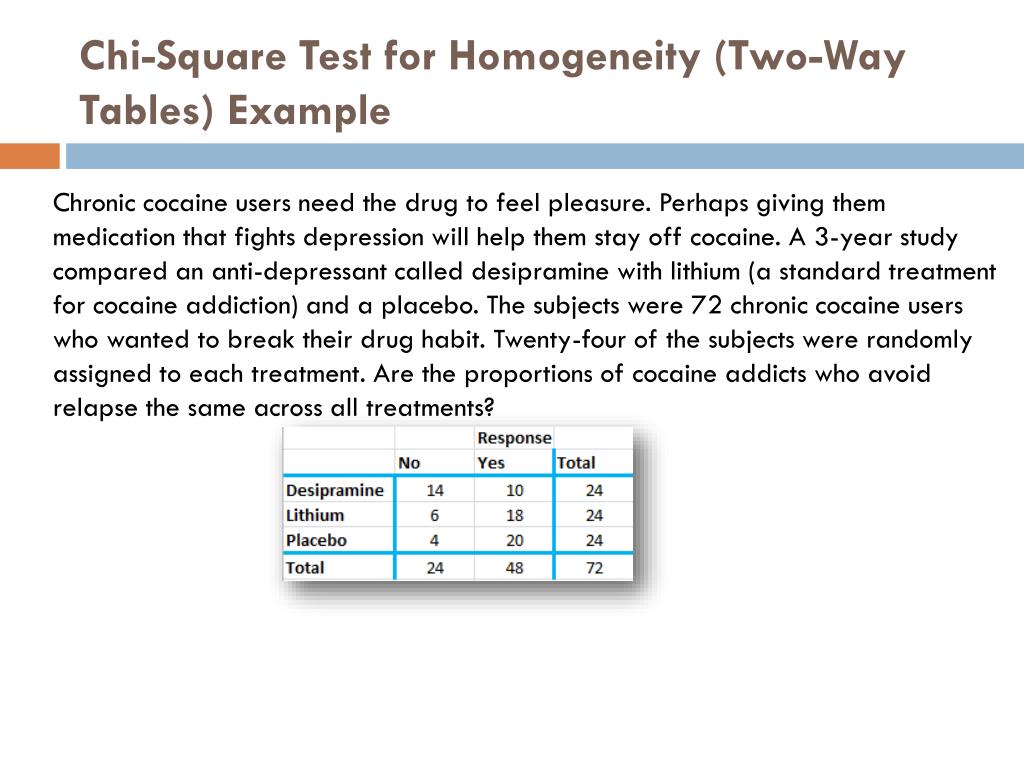
Alright, I promise to keep this part as painless as possible. The Chi-Square Test of Homogeneity compares the observed frequencies (what you actually see in your data) with the expected frequencies (what you'd expect to see if the groups were perfectly homogeneous).
Let's say you survey 100 people in each of three cities (New York, Los Angeles, and Chicago) about their favorite pizza topping: pepperoni, mushrooms, or plain cheese.
The observed frequencies are the actual numbers you get from your survey. Maybe you find that:
- New York: 40 pepperoni, 30 mushrooms, 30 cheese
- Los Angeles: 25 pepperoni, 50 mushrooms, 25 cheese
- Chicago: 35 pepperoni, 20 mushrooms, 45 cheese
Now, if all three cities had the exact same pizza preferences, we'd expect the proportions to be equal. The Chi-Square test calculates what those expected frequencies would be, and then compares them to the actual observed frequencies.
If the observed and expected frequencies are very different, it suggests that the groups are not homogeneous. The bigger the difference, the stronger the evidence against homogeneity.
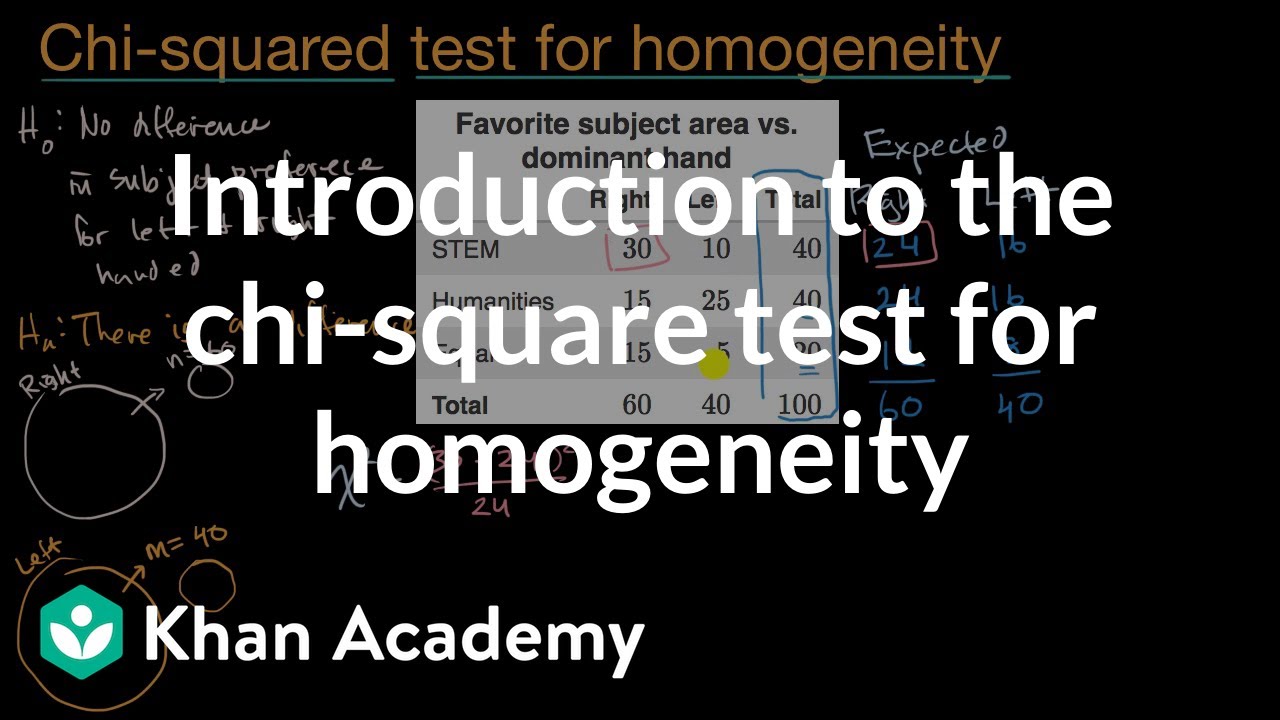
Don't worry, you don't have to do all the calculations by hand! Statistical software like SPSS, R, or even online calculators can handle the math for you. The important thing is understanding what the test means and how to interpret the results.
Interpreting the Results: Are We Really That Different?
The test gives you a p-value. Think of the p-value as the probability of seeing the observed differences (or even more extreme differences) if the groups were actually homogeneous.
Typically, if the p-value is less than 0.05 (or 5%), we reject the idea that the groups are homogeneous. This means there's strong evidence that the groups are actually different.
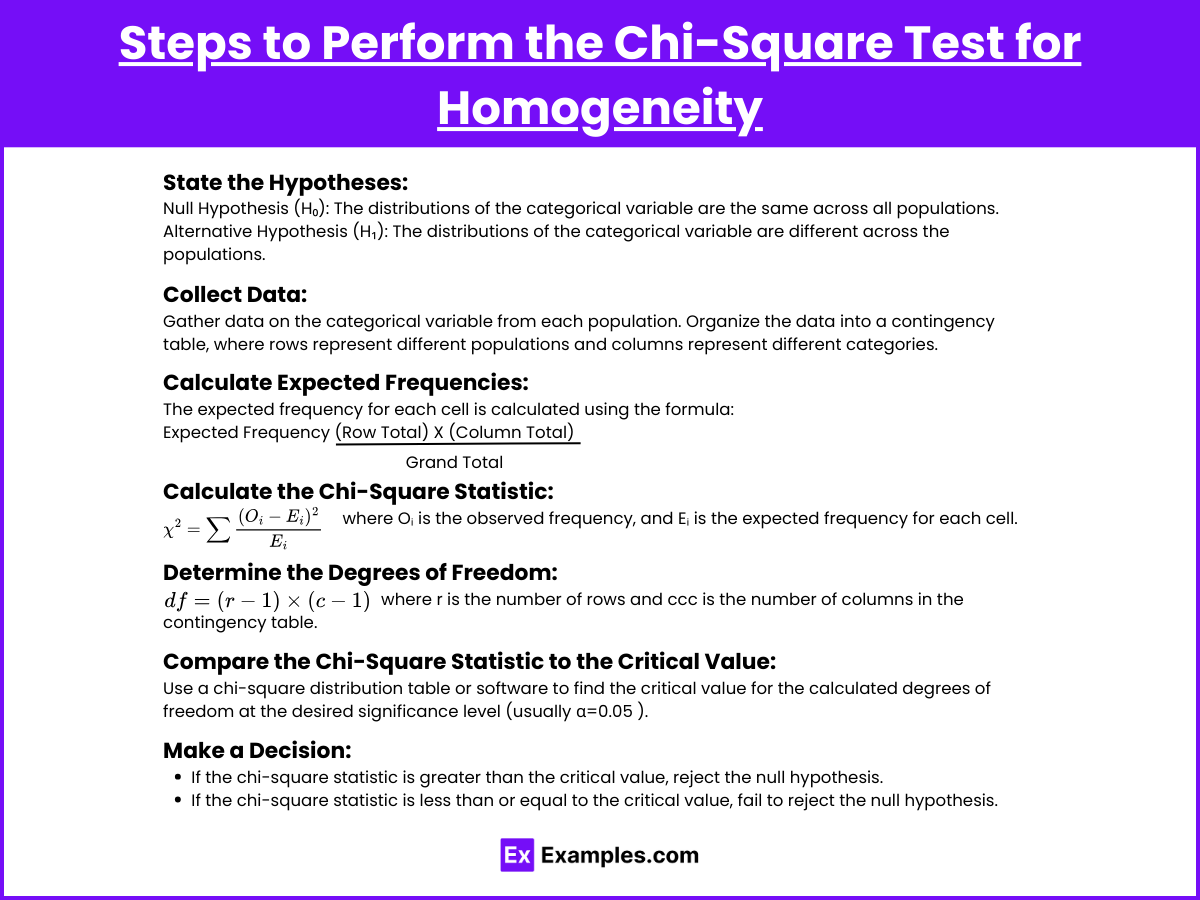
Going back to our pizza example, if the p-value is less than 0.05, you can confidently say that pizza topping preferences do vary significantly between New York, Los Angeles, and Chicago! You could then dig deeper to understand why those preferences differ.
In a Nutshell...
The Chi-Square Test of Homogeneity is a powerful tool for comparing different groups and seeing if they truly differ in terms of a specific characteristic. It's used everywhere from marketing to politics to understanding why you crave pickles at midnight. While the math behind it can seem intimidating, the core idea is simple: Are the groups really that different, or is it just a coincidence?
So, the next time you hear someone say "Everyone my age loves this!", you can use this test to check if there is actual evidence or it's just a personal bias! Go forth and be a pattern detective!