Ever found yourself staring at a hurricane map, seeing all those colorful blobs and lines, and feeling a bit like you’re trying to decipher an ancient alien language? You’re not alone! But what if I told you it’s actually a super cool, super interesting way to get a peek behind the curtain of one of nature’s most powerful shows? Think of it like learning the secret handshake to the weather world. It’s less about panic, and more about understanding what’s happening and why, which is pretty empowering, right?
Let’s dive into some of the neat stuff these maps tell us, without needing a meteorology degree. It’s honestly like being a weather detective, piecing together clues to understand the big picture. And trust me, once you get the hang of it, you’ll be impressing your friends with your newfound storm-reading superpowers!
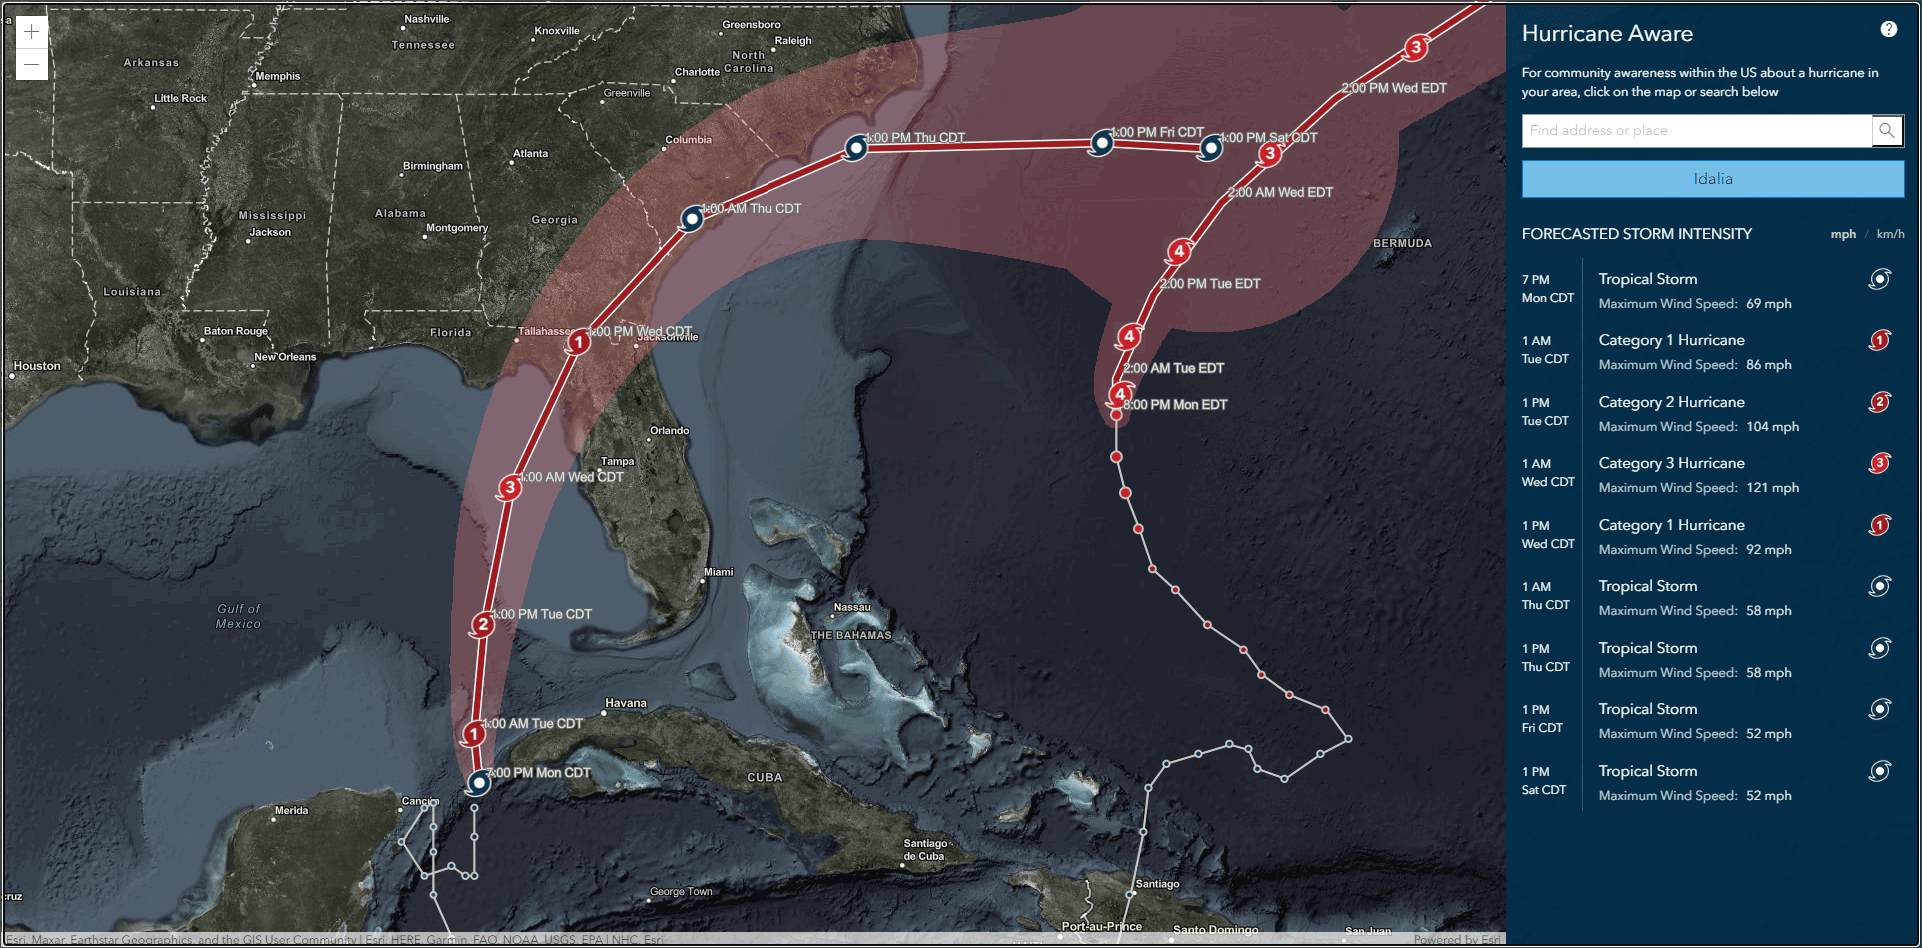
The Star of the Show: The Cone of Uncertainty
Okay, first up, let’s talk about that big, wide, often shaded area that looks like a giant ice cream cone pointing somewhere. This is perhaps the most famous, and sometimes most misunderstood, part of a hurricane map: the "Cone of Uncertainty."
What does it mean? Simply put, it shows the probable track of the hurricane’s center. But here’s the crucial bit: it’s not a bullseye! It doesn't mean the storm will only hit within that cone, or that once the storm passes out of it, you’re suddenly safe. Instead, it represents the area where the center of the storm is expected to track about 60-70% of the time. Think of it less like a solid wall and more like a high-five from a very enthusiastic, slightly wobbly friend – their hand might land anywhere in that general area.
Why is it uncertain? Well, hurricanes are complex beasts! They’re influenced by so many things: ocean temperatures, wind patterns high in the atmosphere, even other weather systems. Predicting their exact path days in advance is like trying to guess where a butterfly will land a week from now. Meteorologists use super powerful computers and tons of data, but tiny changes can have big ripple effects. So, that cone is their best guess, acknowledging that there's always a bit of wiggle room. It’s a beautifully honest way of saying, "This is what we know now, but things can change." Pretty fascinating, huh?
The Skinny Line Down the Middle: The Forecast Track
Inside that big, friendly cone, you’ll usually see a bold line, sometimes with little dots or circles marking future days. This is the "forecast track," and it represents the *most likely* path the hurricane’s center is predicted to take. It’s like the meteorologist’s best educated guess for the storm’s trajectory.
Is it always accurate? Not 100%, and that's okay! Remember the cone? The track is just the middle of that cone, the single best forecast. But the actual storm could track anywhere within that cone, or even occasionally just outside it. So, while it gives us a good idea, it's super important not to focus solely on that one line. It’s less a definitive highway, and more a suggestion of the scenic route the storm might take.
Colors, Colors Everywhere! Understanding Intensity
Now, let's talk about the colors you often see on these maps. These usually correspond to the Saffir-Simpson Hurricane Wind Scale, which classifies hurricanes by their sustained wind speeds. It’s essentially a color-coded warning system, going from tropical depressions (no real color, just a symbol) up to Category 5 behemoths.
You might see different shades of yellow, orange, red, and even purple. Generally:
- Yellow/Green: Often for tropical depressions or tropical storms (wind speeds up to 73 mph). Still serious, but not yet a hurricane.
- Orange: Typically Category 1 or 2 hurricanes (74-110 mph winds). Significant damage possible.
- Red/Dark Red: Category 3 or 4 hurricanes (111-156 mph winds). Major, devastating damage.
- Purple/Magenta: The big one, Category 5 (157+ mph winds). Catastrophic damage.
These colors are often used to show the storm's *current* intensity or its *forecasted* intensity at different points along its track. It’s like a visual shorthand, telling you at a glance just how powerful a punch the storm is packing. Pretty neat how a simple color can convey so much vital information, right?
Beyond the Center: Wind Swaths and Watches/Warnings
Sometimes you'll see broader areas shaded around the track and cone, perhaps in lighter colors or with different line patterns. These often indicate areas expected to experience tropical storm force winds (39-73 mph) or hurricane force winds (74+ mph). Remember, hurricane-force winds aren't just at the center; they can extend hundreds of miles outwards! So, even if the center is far from you, you could still experience significant winds.
And then there are the famous Watches and Warnings. These are like traffic signals for storms:
- Watch: "Heads up! These conditions are *possible* in your area within 48 hours. Stay alert!"
- Warning: "Action time! These conditions are *expected* in your area within 36 hours. Prepare now!"
These are super important for local decision-making and preparedness, so always look for them on official maps from your local weather authority.
So, Why Is This All So Cool?
Learning to read a hurricane map isn't about becoming an expert forecaster. It’s about becoming an informed citizen. It gives you a deeper appreciation for the immense power of nature and the incredible science behind forecasting. It empowers you to understand the potential risks, make smart decisions for yourself and your loved ones, and maybe even help calm a nervous friend by explaining what that "cone" really means.
It’s like unlocking a secret level in a game, but the game is understanding our planet. So next time you see that swirling mass of pixels and colors on your screen, don’t just glaze over it. Lean in, get curious, and enjoy the fascinating story it’s telling you about the dynamic world we live in. Who knew weather maps could be so captivating?