Stress Strain Graphs For Different Materials

Ever wonder why a rubber band stretches and snaps, while a steel bridge stands firm under tons of weight? The answer lies in understanding how different materials behave under stress, and how much they strain or deform as a result. It might sound like something from a dry engineering textbook, but trust me, it's surprisingly fascinating and relevant to everyday life! Learning about stress-strain graphs is like unlocking a secret code to understanding the world around you – a world built of different materials, each with its own unique properties.
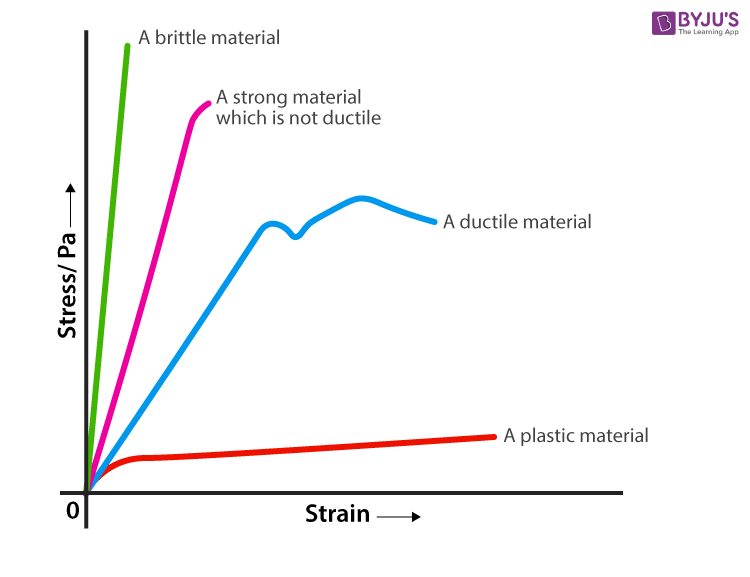
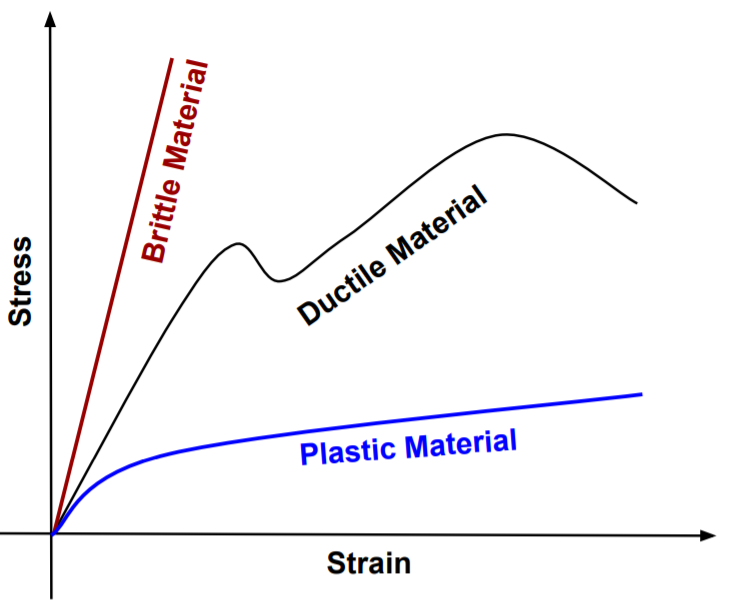
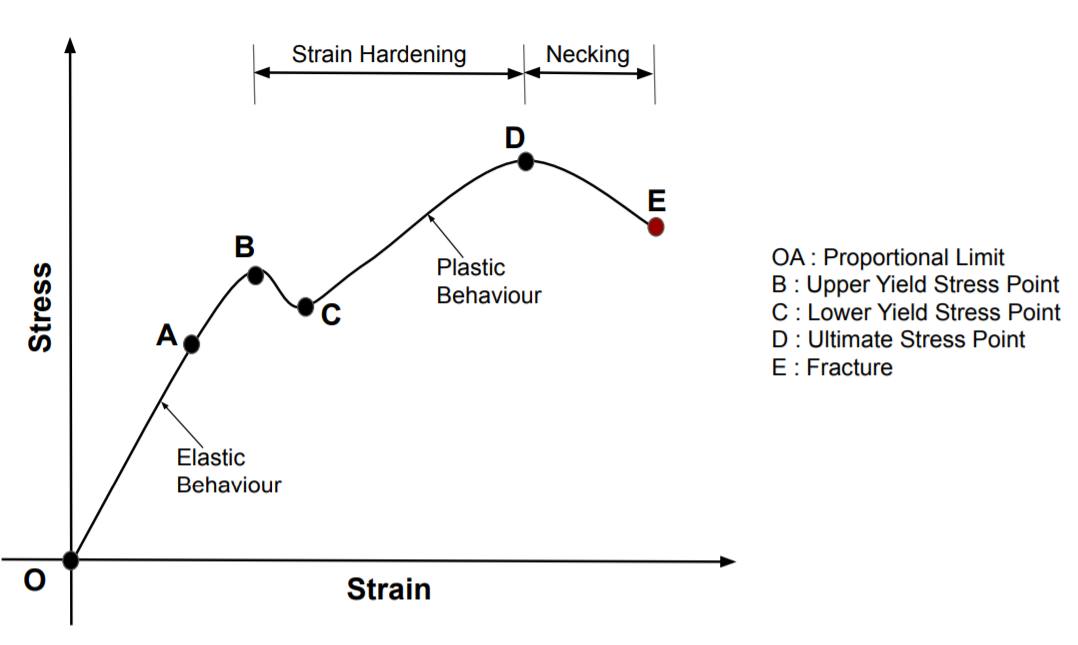
So, what exactly are these stress-strain graphs? Simply put, they're visual representations that show the relationship between the stress applied to a material (the force per unit area) and the resulting strain (the deformation of the material). Imagine pulling on a rubber band. The more you pull (applying more stress), the more it stretches (resulting in more strain). A stress-strain graph plots these values against each other, revealing a material's response to applied force. The beauty of these graphs is that they allow us to predict how a material will behave under different conditions. This is incredibly useful in everything from designing safer airplanes to creating more comfortable running shoes.
The purpose and benefits of understanding stress-strain graphs are numerous. For engineers, it's crucial. They use these graphs to select the appropriate materials for specific applications. For example, if you're building a bridge, you need a material that can withstand high stress without excessive strain. This means you'd choose steel, which has a high yield strength (the point at which it starts to deform permanently) and tensile strength (the maximum stress it can withstand before breaking). On the other hand, if you're designing a shock absorber, you'd want a material that can undergo a large amount of strain before failing, like a type of rubber. Understanding these graphs helps prevent catastrophic failures and ensures the safety and longevity of structures and products.
Must Read
Beyond engineering, stress-strain principles are subtly present in many aspects of daily life. Consider a chef kneading dough. They're essentially manipulating the stress on the dough to achieve the desired strain and texture. Or think about the soles of your shoes – they're designed to withstand repeated stress and strain from walking, providing cushioning and support. Even the clothes we wear are made from materials with specific stress-strain properties that determine their comfort, durability, and how they drape on the body.
Want to explore this further? Here are a few simple ways to get started: Experiment with different types of rubber bands. Stretch them and observe how they behave. Which one stretches the most before breaking? Which one feels the strongest? You can even try stretching different types of string or wire (with adult supervision, of course!). Another fun activity is to research the materials used in common objects around you, such as your phone case or bicycle frame. Try to find out why those specific materials were chosen based on their strength and flexibility. There are also numerous online resources, interactive simulations, and videos that explain stress-strain graphs in an accessible way. Start with a simple search like "stress-strain graph explained" and dive into the fascinating world of material science!